You merge data from Sales.Region, Region_Manager, Sales_Manager, and Manager into a single table named Region. What should you do next to meet the reporting requirements of the executives?
Apply row-level security (RLS) to the Region table based on the sales manager username.
Configure a bi-directional relationship between Region and Sales.Region.
Create a DAX calculated column that retrieves the region manager from the Weekly.Returns table based on the sales.regionjd column.
In the Region table, create a hierarchy that has the manager name, and then the sales manager name.
You need to create a relationship between the Weekly_Returns table and the Date table to meet the reporting requirements of the regional managers. What should you do?
In the Weekly.Returns table, create a new calculated column named date-id in a format of yyyymmdd and use the calculated column to create a relationship to the Date table.
Add the Weekly_Returns data to the Sales table by using related DAX functions.
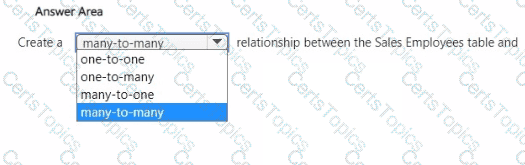
Create a new table based on the Date table where date-id is unique, and then create a many-to-many relationship to Weekly_Return.
Scenario: Region managers require a visual to analyze weekly sales and returns.
To relate the two tables we need a common column.
You need to address the data concerns before creating the data model. What should you do in Power Query Editor?
Select Column distribution.
Select the sales_amount column and apply a number filter.
Select Column profile, and then select the sales_amount column.
Transform the sales_amount column to replace negative values with 0.
You need to get data from the Microsoft SQL Server tables. What should you use to configure the connection'
import that uses a Microsoft account
DirectQuery that uses the end-user s credentials
DirectQuery that uses a database credential
Import that uses a database credential
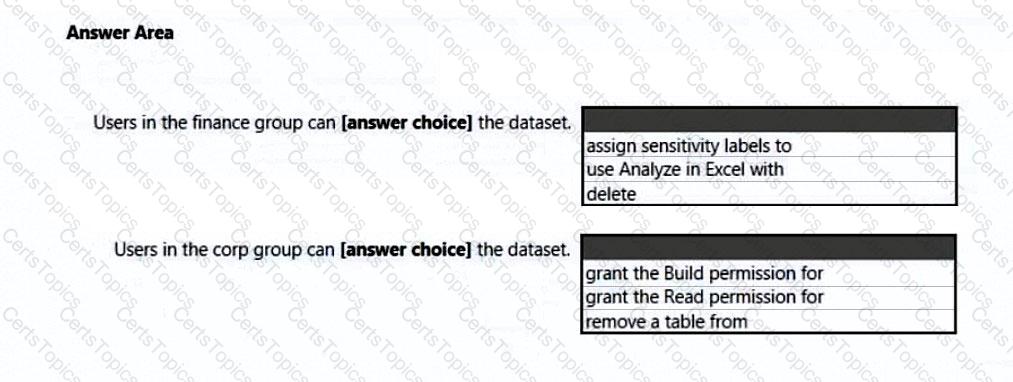
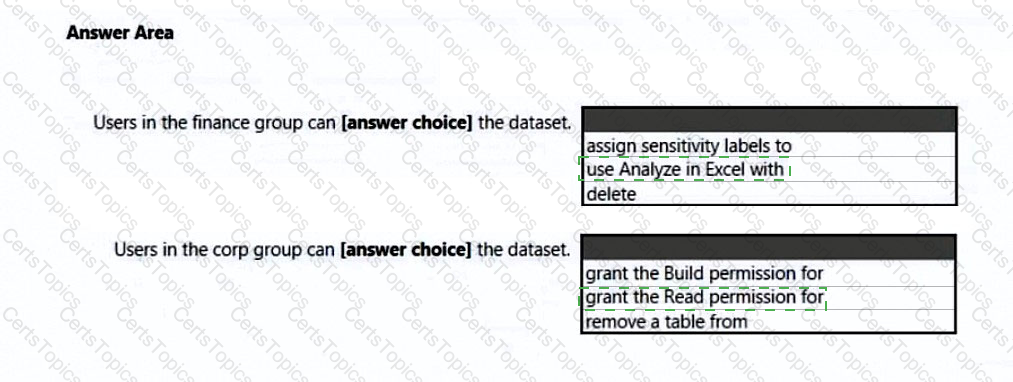
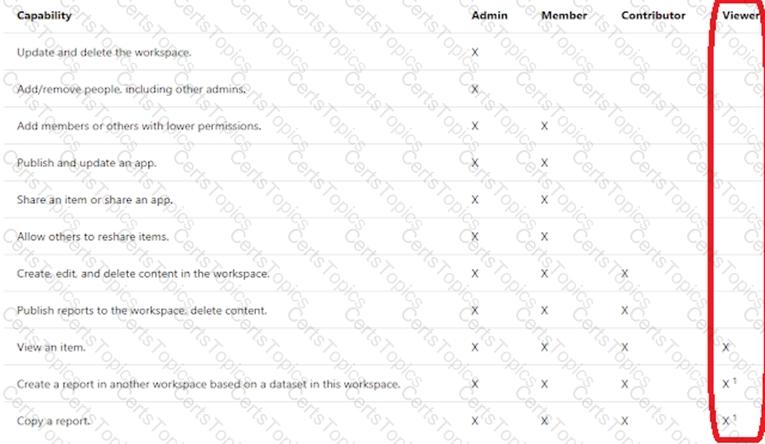
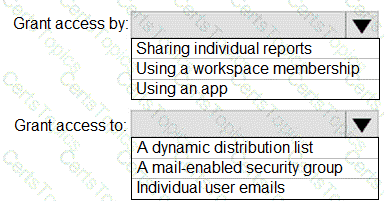
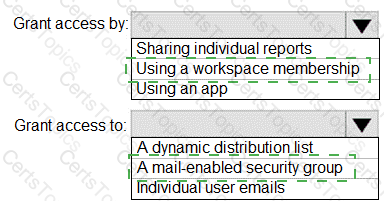
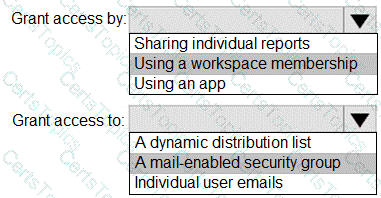
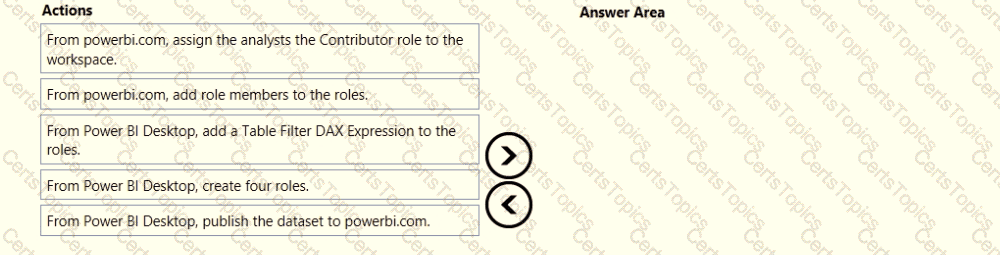
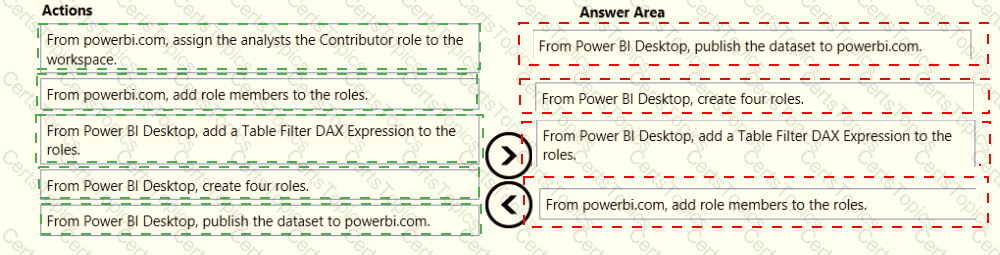
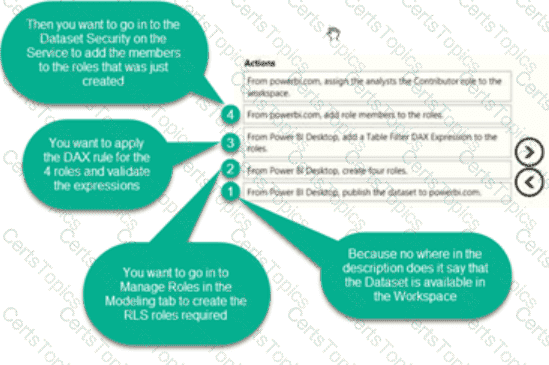
You need to provide a solution to provide the sales managers with the required access.
What should you include in the solution?
Create a security role that has a table filter on the Sales_Manager table whereusername = UserName()
Create a security role that has a table filter on the Region_Manager table wheresales_manager_id = UserPrincipalName().
Create a security role that has a table filter on the Sales_Manager table wherename = UserName().
Create a security role that has a table filter on the Sales_Manager table whereusername = sales_manager_id.
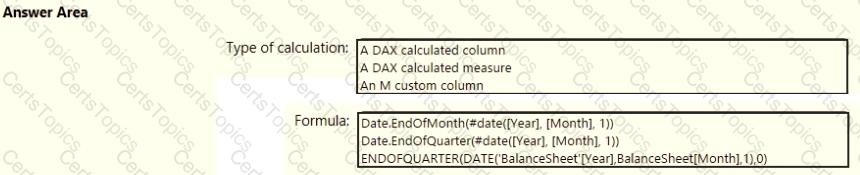
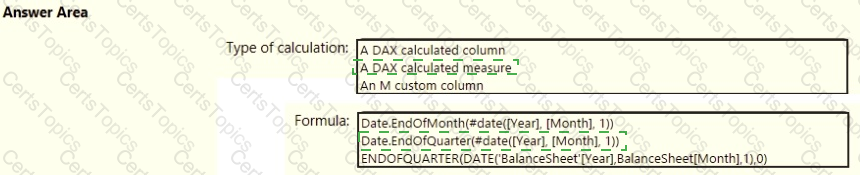
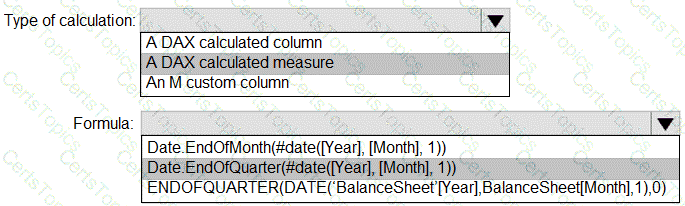
You need to create a calculated column to display the month based on the reporting requirements. Which DAX expression should you use?
FORMAT('Date'[date], "MMM YYYY")
FORMAT('Date' [date], "M YY")
FORMAT('Date'[date_id], "MMM") & "" & FORMAT('Date'[year], "#")
FORMAT('Date' [date_id], "MMM YYYY")
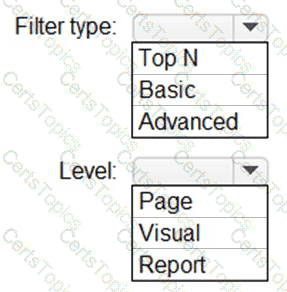
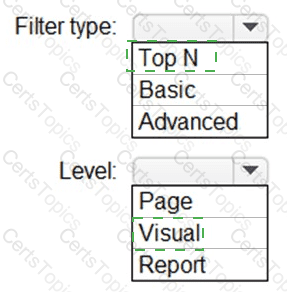
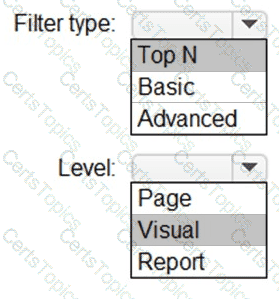
You need to create a visualization to meet the reporting requirements of the sales managers.
How should you create the visualization? To answer, select the appropriate options in the answer area.
NOTE: Each correct selection is worth one point.
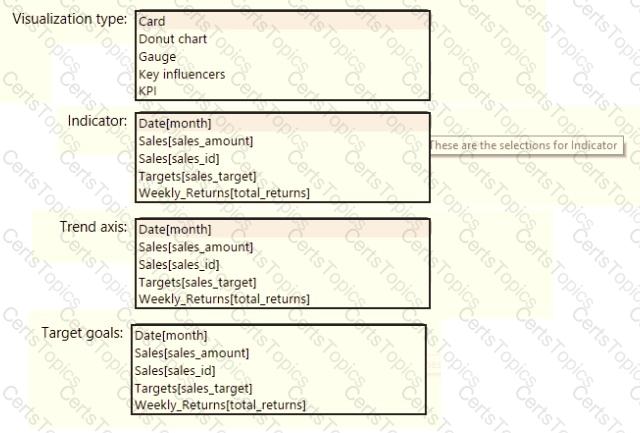
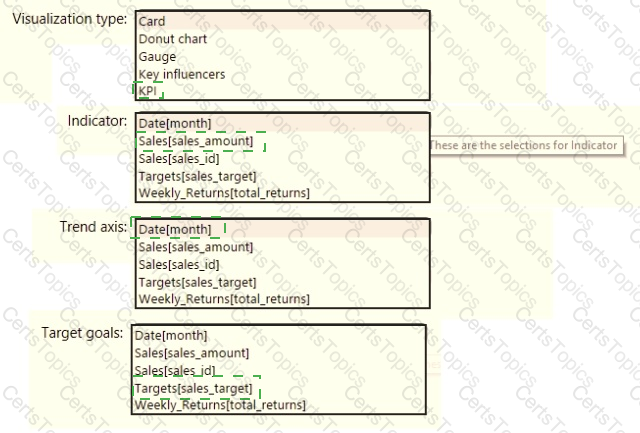
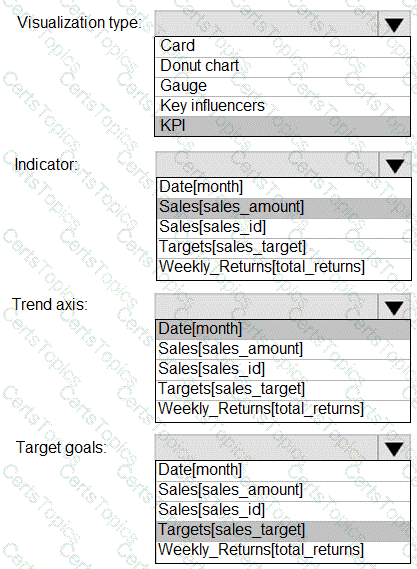
Scenario: The sales managers require a visual to analyze sales performance versus sales targets.
Box 1: KPI
A Key Performance Indicator (KPI) is a visual cue that communicates the amount of progress made toward a measurable goal.
Box 2: Sales[sales_amount]
Box 3: Date[month]
Time > FiscalMonth. This value will represent the trend.
Box 4: Targets[sales_target]
You need to create the required relationship for the executive's visual. What should you do before you can create the relationship?
Change the data type of Sales[region_id] to Whole Number.
In the Sales table, add a measure for sum(sales_amount).
Change the data type of sales[sales_id] to Text.
Change the data type of sales [region_id] to Decimal Number.
Scenario: Executives require a visual that shows sales by region.
Need to change the sales_id column from Varchar to Whole Number (Integer).
What should you create to meet the reporting requirements of the sales department?
a measure that uses a formula of SUM (Sales [sales_id])
a calculated column that use a formula of COUNTA(sales [sales_id])
a measure that uses a formula of COUNTROWS (Sales)
a calculated column that uses a formula of SUM (Sales [sales_id])
The sale department requires reports that contain the number of sales transactions.
The COUNTROWS function counts the number of rows in the specified table, or in a table defined by an expression.
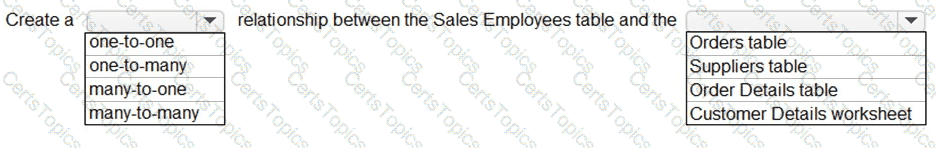
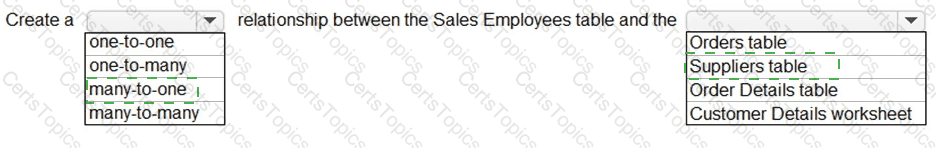
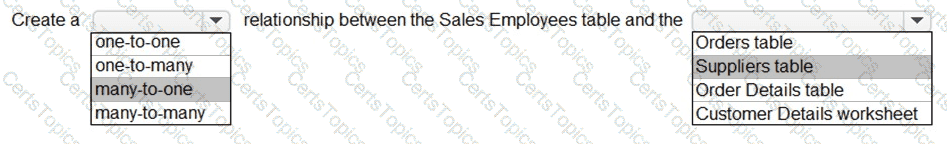
You need to create relationships to meet the reporting requirements of the customer service department.
What should you create?
an additional date table named ShipDate, a one-to-many relationship fromSales[sales_date_id] to Date[date_id], and a one-to-many relationship fromSales[sales_ship_date_id] to ShipDate[date_id]
an additional date table named ShipDate, a many-to-many relationship fromSales[sales_date_id] to Date[date_id], and a many-to-many relationship fromSales[sales_ship_date_id] to ShipDate[date_id]
a one-to-many relationship from Date[date_id] to Sales[sales_date_id] and another one-to-many relationship from Date[date_id] to Weekly_Returns[week_id]
a one-to-many relationship from Sales[sales_date_id] to Date[date_id] and a one-to-manyrelationship from Sales[sales_ship_date_id] to Date[date_id]
a one-to-many relationship from Date[date_id] to Sales[sales_date_id] and another one-to-many relationship from Date[date_id] to Sales[sales_ship_date_id]
Scenario: The customer service department requires a visual that can be filtered by both sales month and ship month independently.
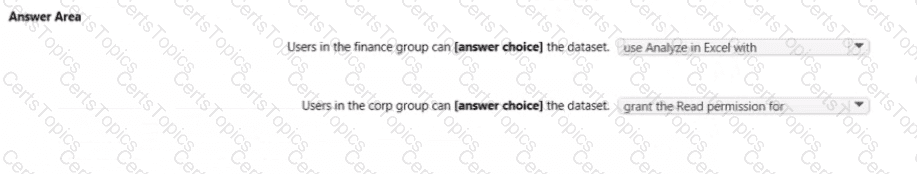
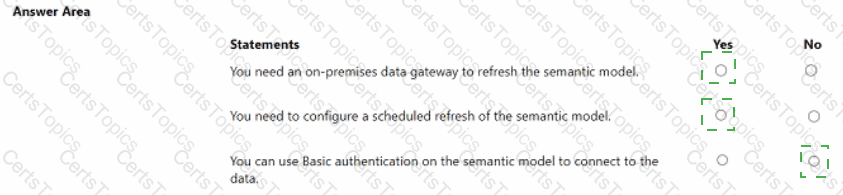
You publish the semantic model to powerbi.com.
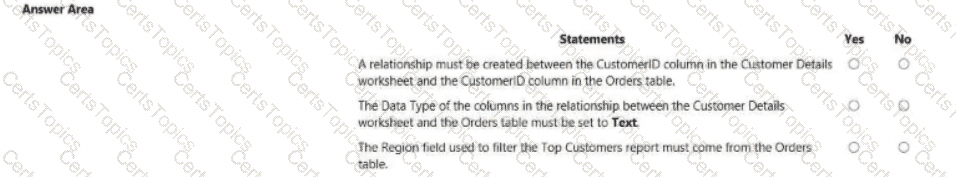
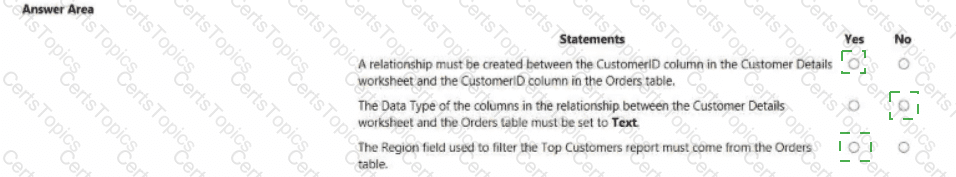
For each of the following statements, select Yes if the statement is true. Otherwise, select No.
NOTE: Each correct selection is worth one point.

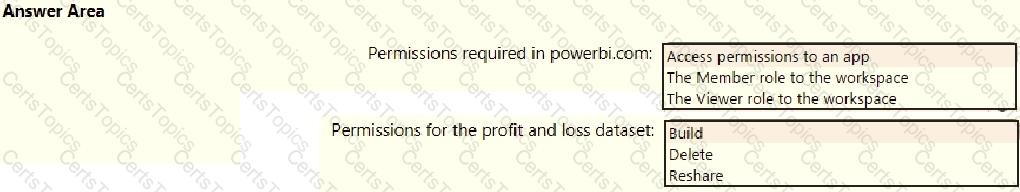
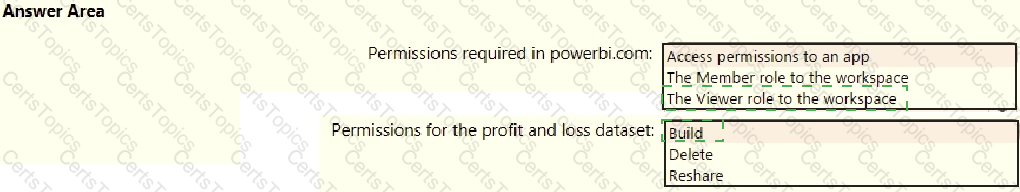
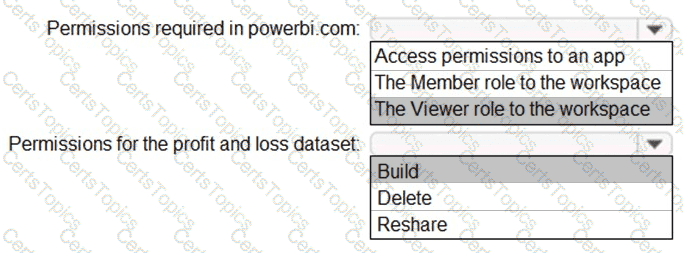
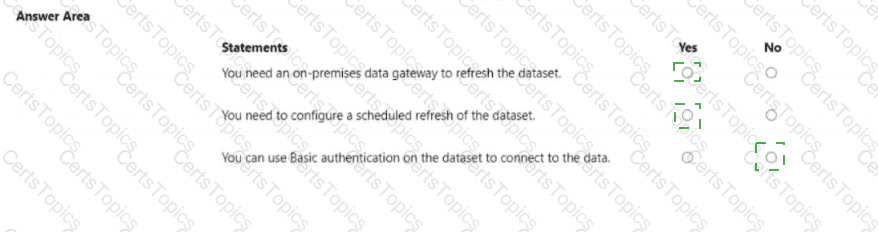
You publish the dataset to powerbi.com.
For each of the following statements, select Yes if the statement is true. Otherwise, select No.
NOTE: Each correct selection is worth one point.

You need to minimize the size of the semantic model. The solution must meet the report requirements.
What should you do?
Filter out discontinued products while importing the Products table.
Group the Categories table by the CategorylD column.
Change the OrderlD column in the Orders table to the Text data type.
Remove the QuantityPerUnit column from the Products table.
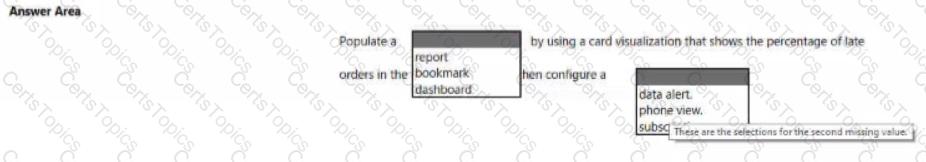
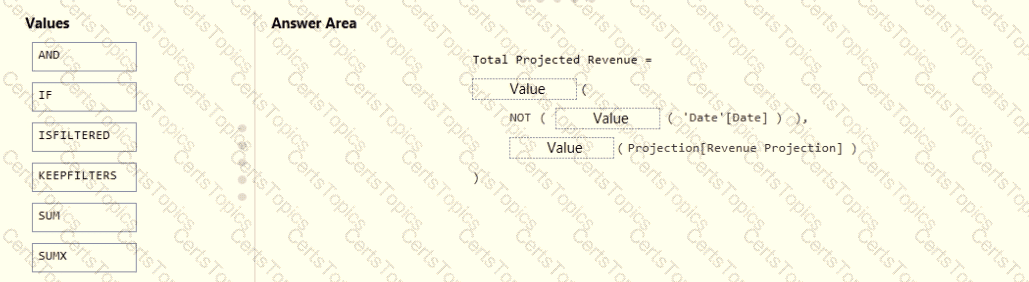
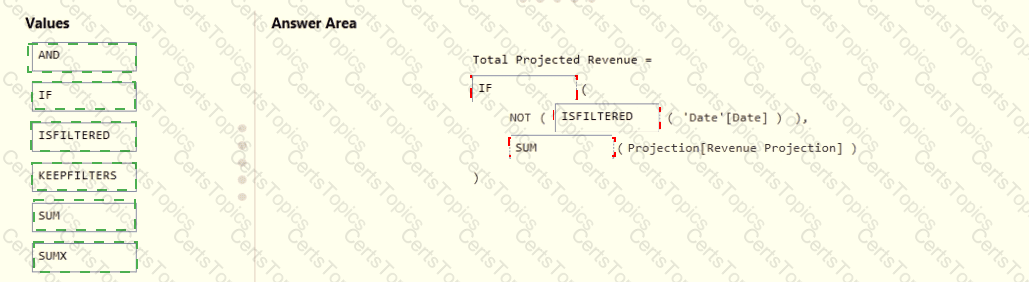
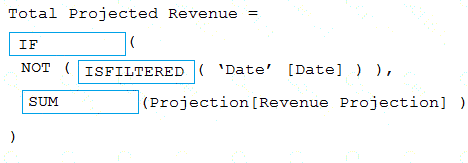
You need to create a measure that will return the percentage of late orders.
How should you complete the DAX expression? To answer, select the appropriate options in the answer area.
NOTE: Each correct selection is worth one point.
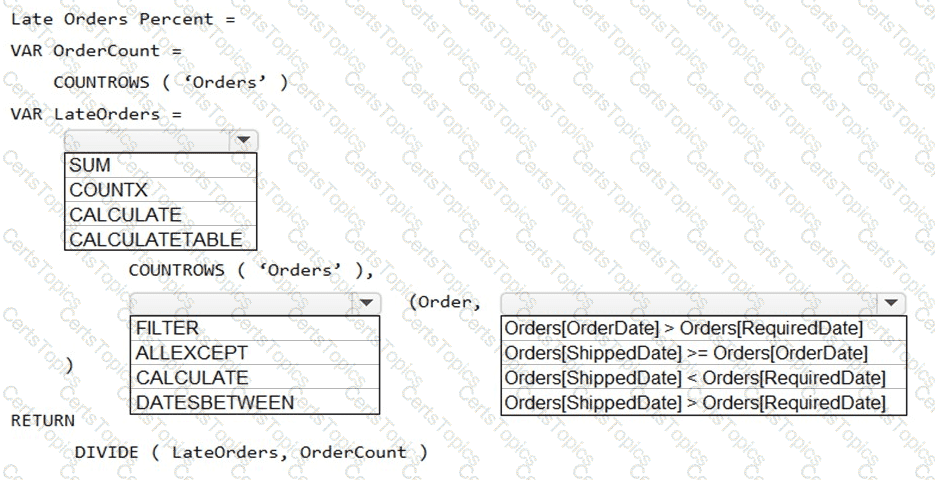
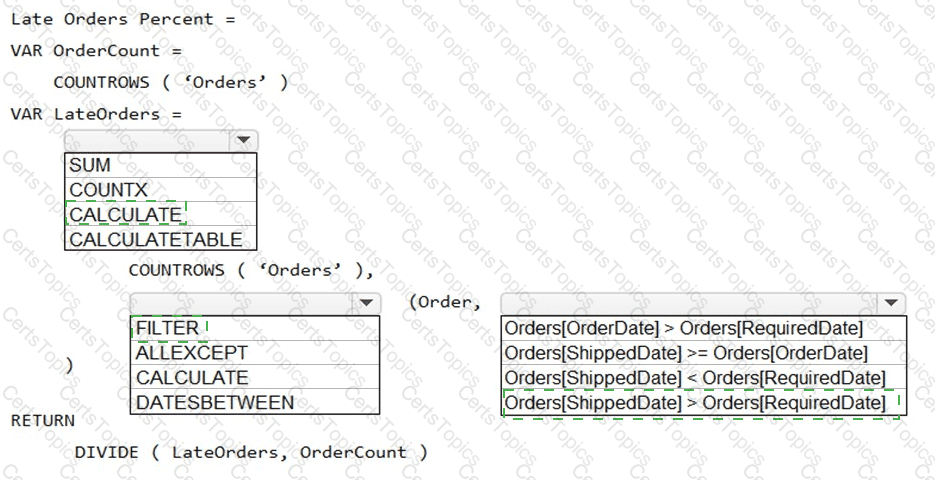
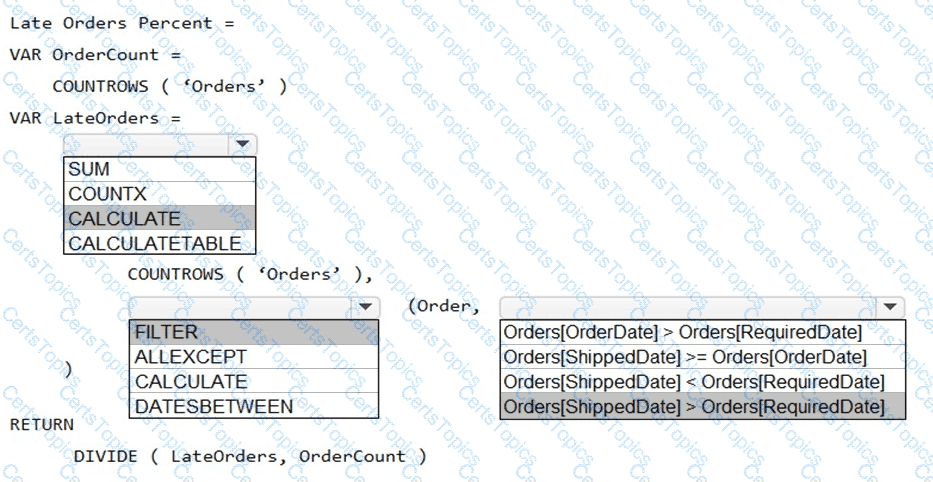
Box 1: CALCULATE
CALCULATE evaluates an expression in a modified filter context.
Syntax: CALCULATE(
Expression - The expression to be evaluated.
filter1, filter2,… (Optional) Boolean expressions or table expressions that defines filters, or filter modifier functions.
Box 2: FILTER
FILTER returns a table that represents a subset of another table or expression.
Syntax: FILTER(