You have a source that contains a comumn. The column contains case sensitive date. You have a Power BI semantic model in DirectQuery mode. You connect to the model and discover that it contains undefined values and errors. You need to resolve the issue.
Solution: You add an index key and normalize casing in the data source.
Does this meet the goal?
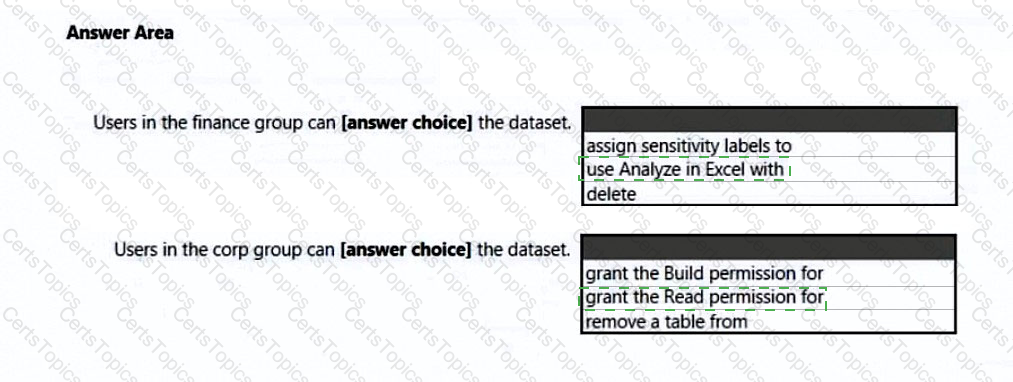
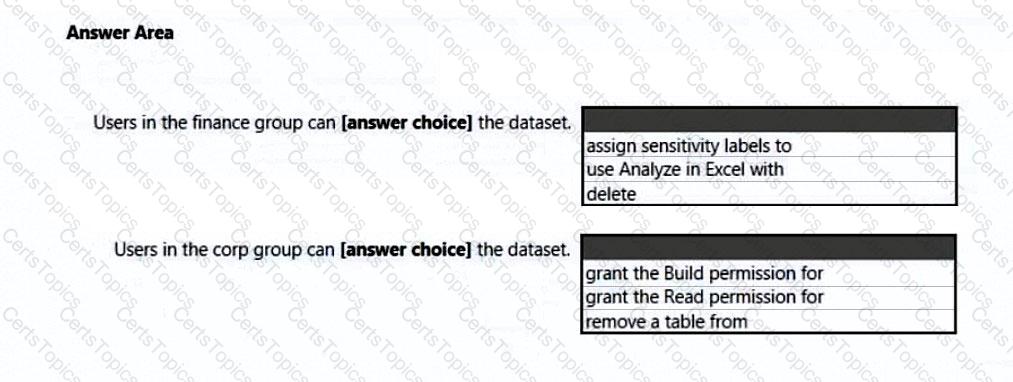
You have a dataset that has the permissions shown in the following exhibit.
Use the drop-down menus to select the answer choice that completes each statement based on the information presented in the graphic.
NOTE: Each correct selection is worth one point.
You have a Power Bl report named Report1 and a dashboard named Dashboard1, Report1 contains a line chart named Sales by month.
You pin the Sales by month visual to Dashboard1.
In Report1, you change the Sales by month visual to a bar chart.
You need to ensure that bar chart displays on Dashboard1.
What should you do?
You have a Power B1 dataset named Finance that is hosted in a Power B1 workspace.
The finance team at your company is NOT currently a member of any Power B1 workspace roles.
You need to enable the finance team to use Microsoft Excel to analyze the Finance dataset.
What should you do?
Copyright © 2021-2026 CertsTopics. All Rights Reserved