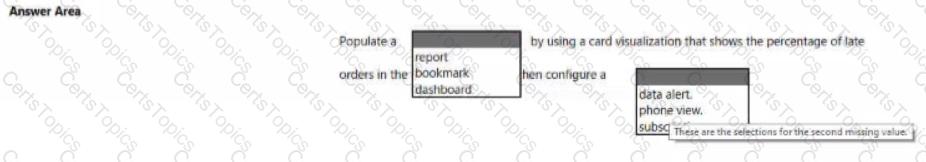
You need to minimize the size of the semantic model. The solution must meet the report requirements.
What should you do?
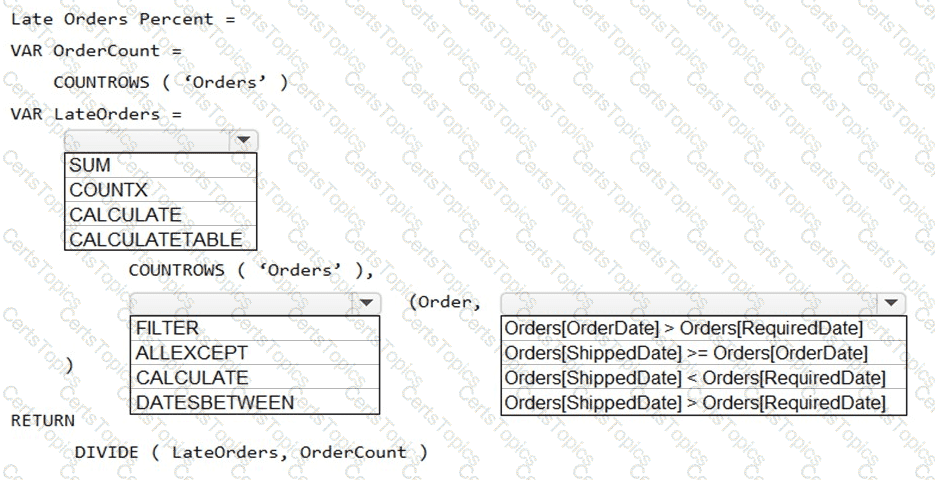
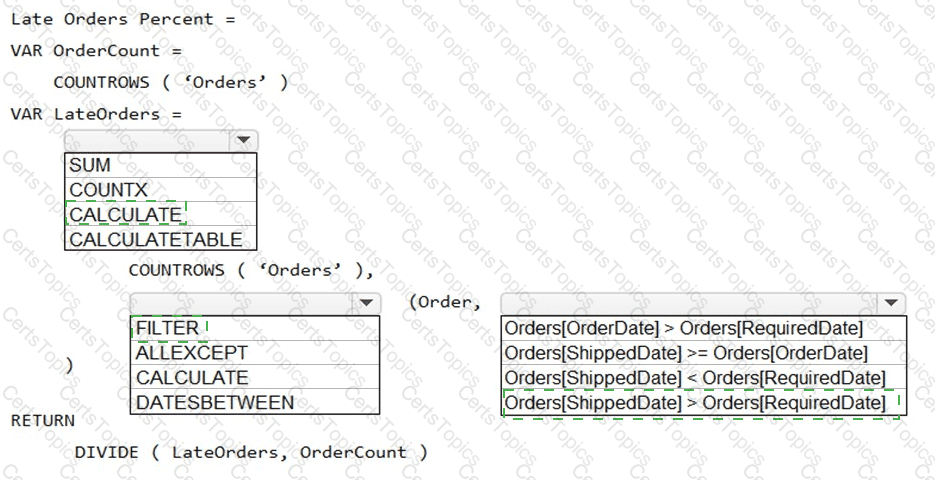
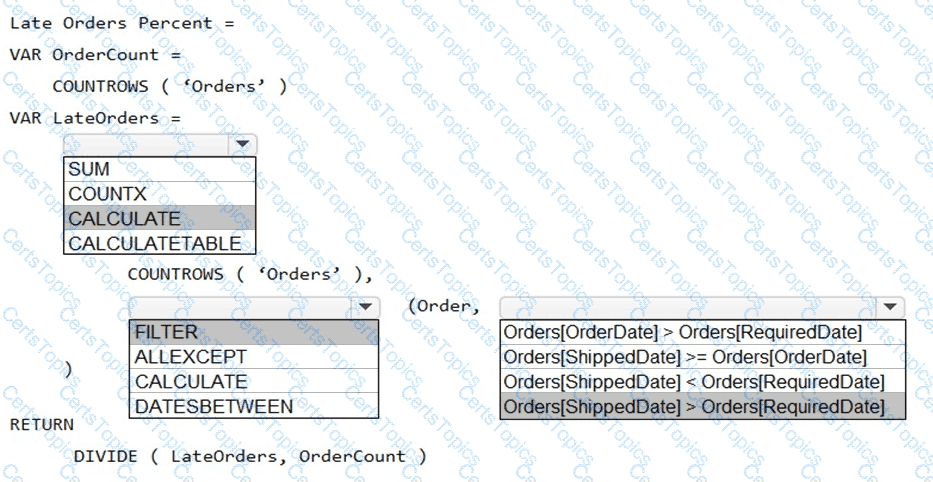
You need to create a measure that will return the percentage of late orders.
How should you complete the DAX expression? To answer, select the appropriate options in the answer area.
NOTE: Each correct selection is worth one point.