You need to create the dataset. Which dataset mode should you use?
You need to design the data model to meet the report requirements.
What should you do in Power BI Desktop?
You need to create the semantic model.
Which storage mode should you use for the tables in the semantic model?
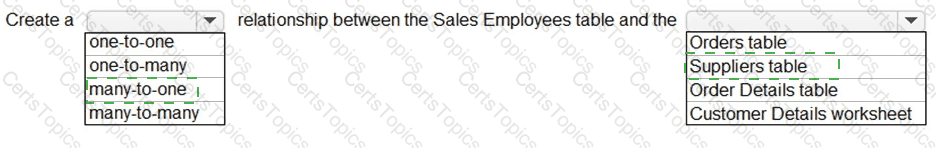
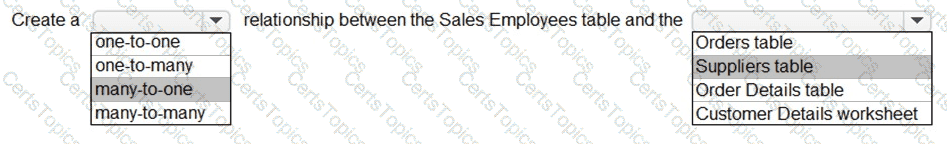
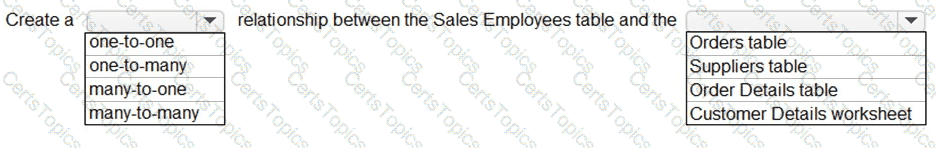
You need to create a relationship in the dataset for RLS.
What should you do? To answer, select the appropriate options in the answer area.
NOTE: Each correct selection is worth one point.
Copyright © 2021-2026 CertsTopics. All Rights Reserved