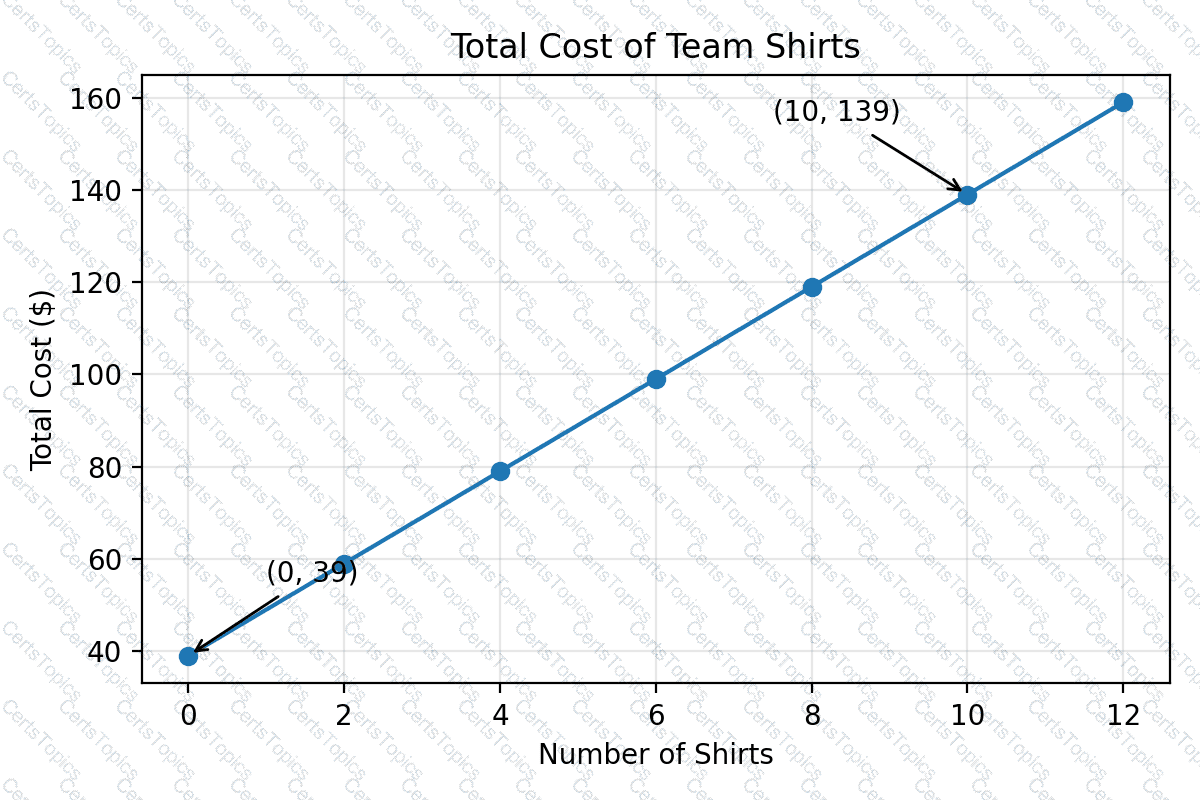
A coach is placing an order for team shirts. The graph shows the total cost based on the number of shirts. What is the cost of each additional shirt?
Exhibit:
The number of letters processed daily at a mail center is modeled by the decreasing exponential function shown in the graph.
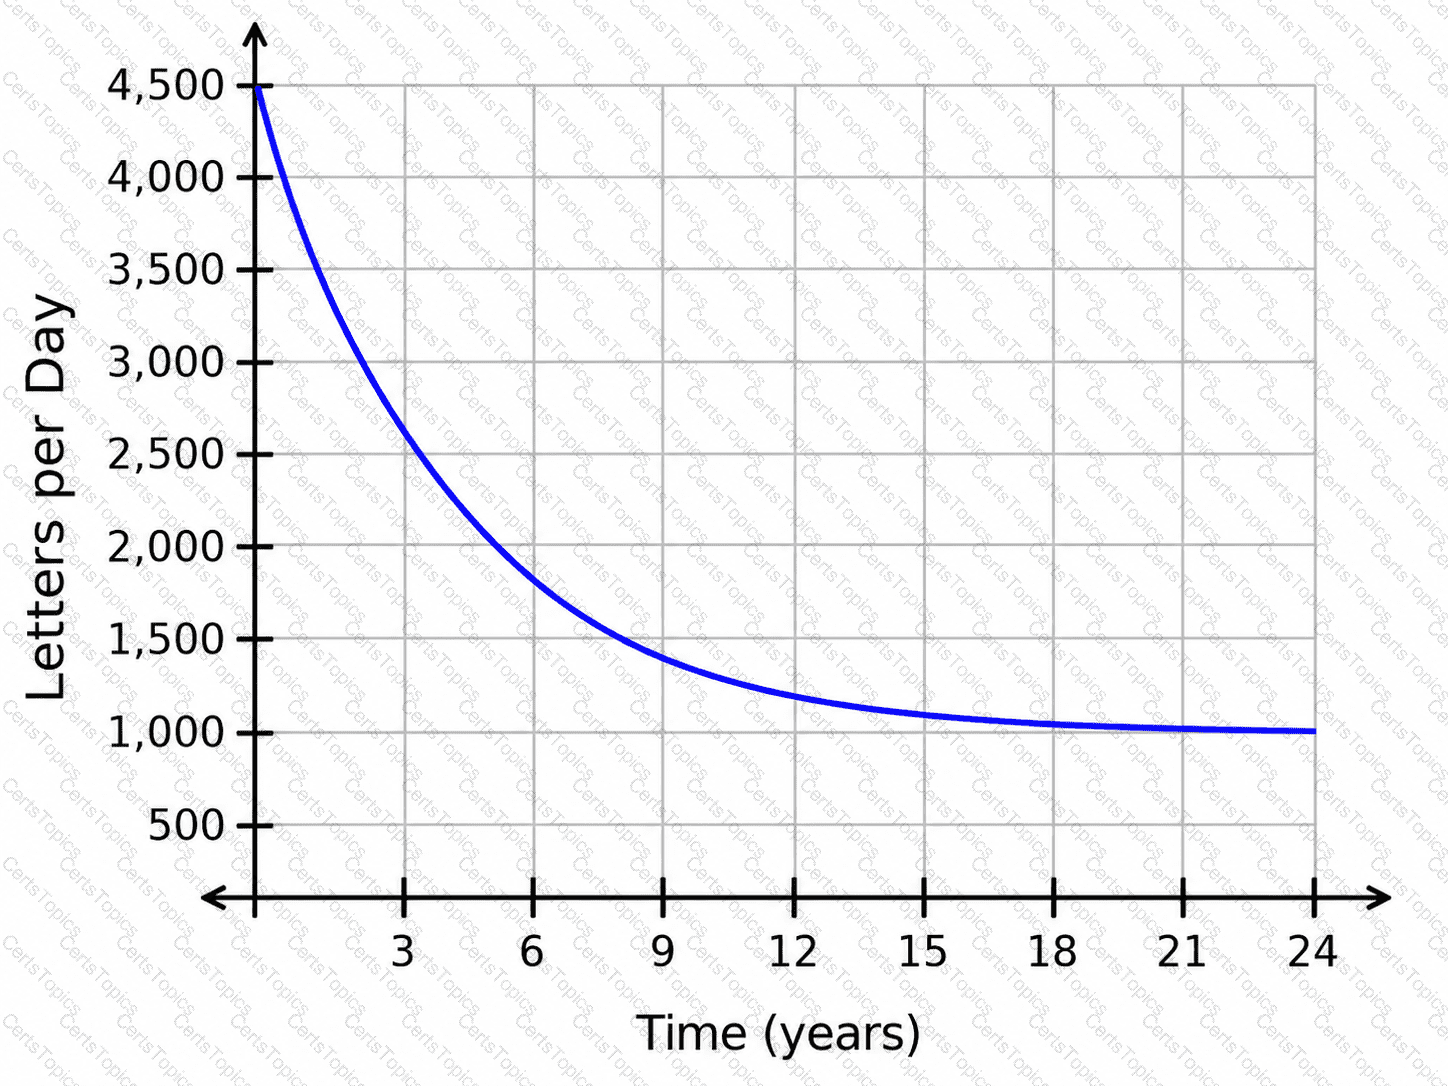
What is the long-term trend in the number of letters processed per day, based on the equation of the horizontal asymptote?
A researcher collected data on the number of daily posts on a blog. The results are shown in the scatterplot. The graphed regression function has an r
2
value of 0.89.
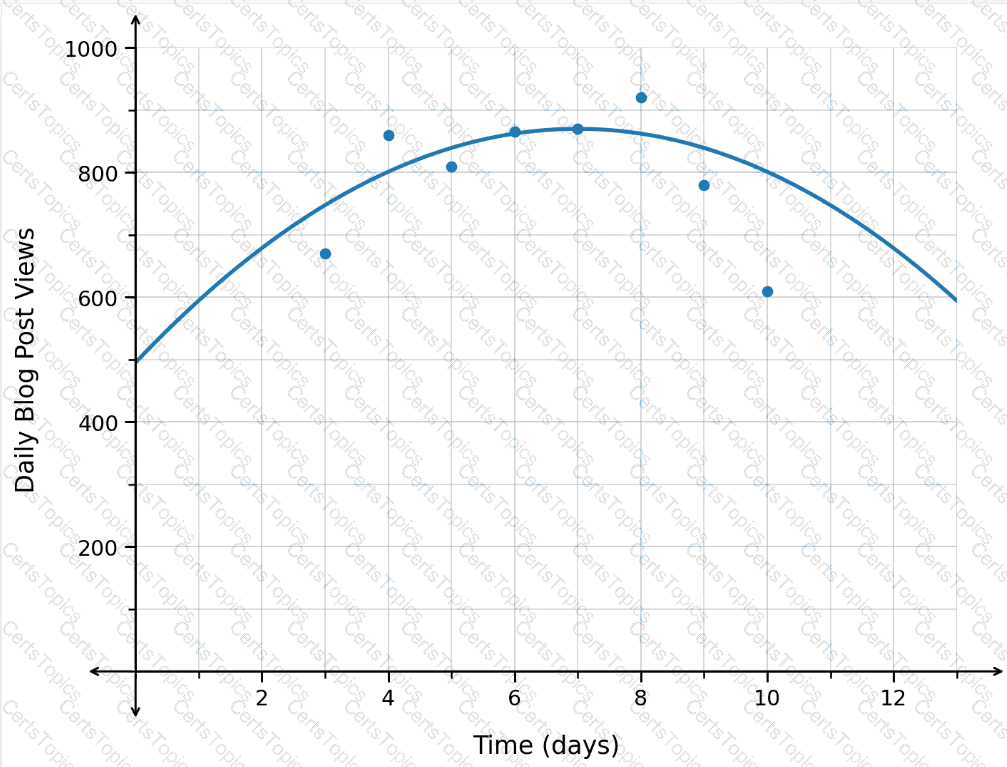
Is it appropriate to make a prediction for the number of daily posts after 18.6 months?
The graphed function v(t) represents the number of vehicles, v, stopped at a toll booth t hours after 6:00 a.m. The coordinates of points A and B are (1,49.4) and (4,45.8), respectively.
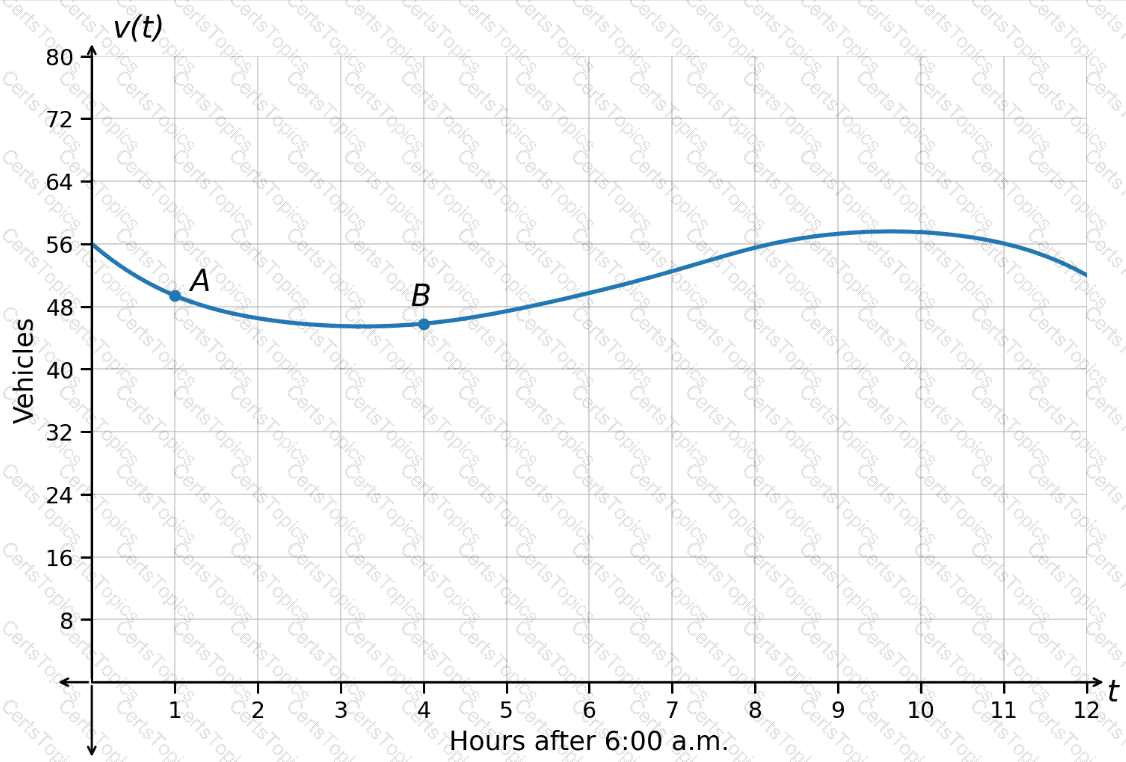
What is the average rate of change of the number of vehicles from point A to point B?
Copyright © 2021-2026 CertsTopics. All Rights Reserved
