The graph shows the weekly profit in hundreds of dollars for a coffee shop. The horizontal axis represents the number of years since the coffee shop opened.
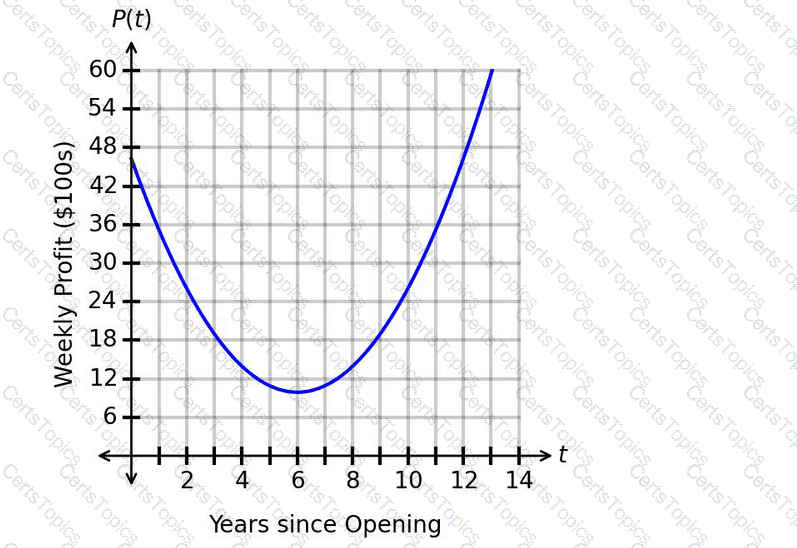
What is the correct interpretation of the minimum value?
The number of registered voters in a district is modeled by a decreasing exponential function, where x represents the number of years since 2005 and f(x) represents the number of registered voters.
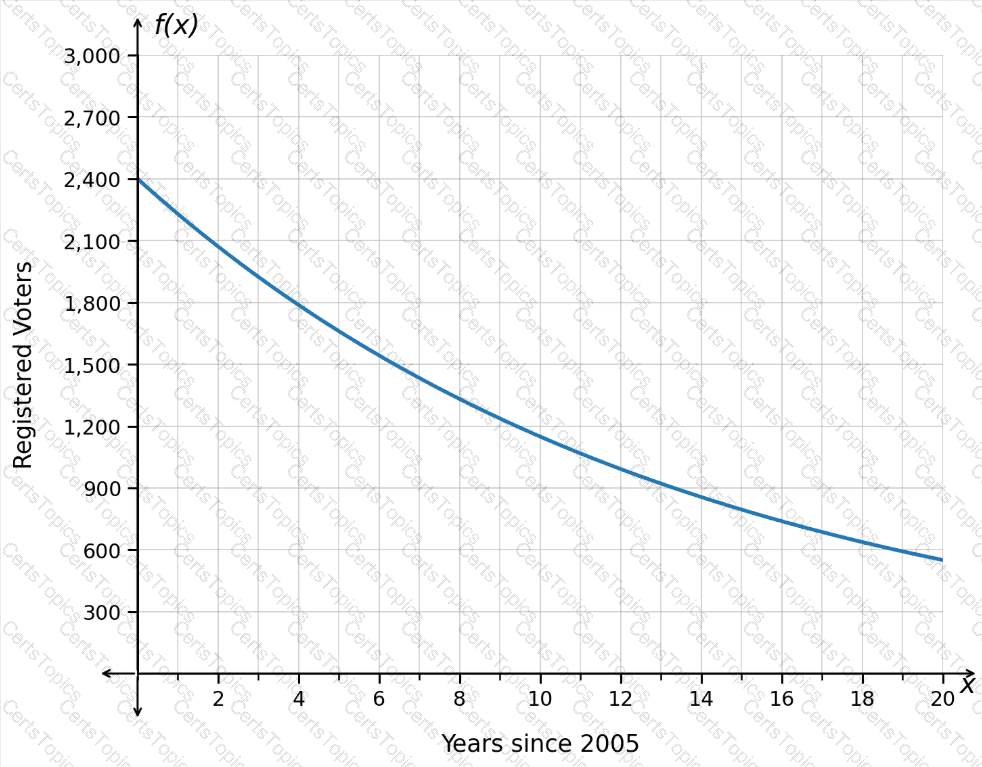
Which interval is associated with the slowest average decrease in the number of registered voters?
The growth of an animal population is shown in the graph. The instantaneous rate of change at point Pis 3.74.
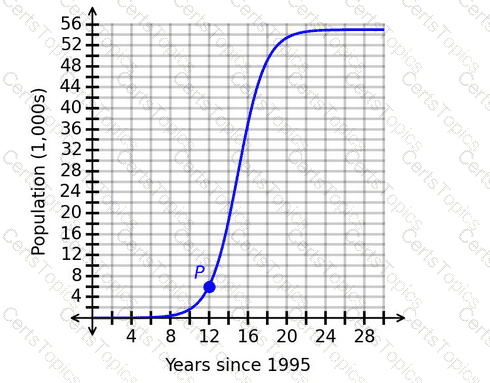
Which interpretation of the instantaneous rate of change is correct?
The spread of two viruses within a single population is modeled using the functions in the graph.
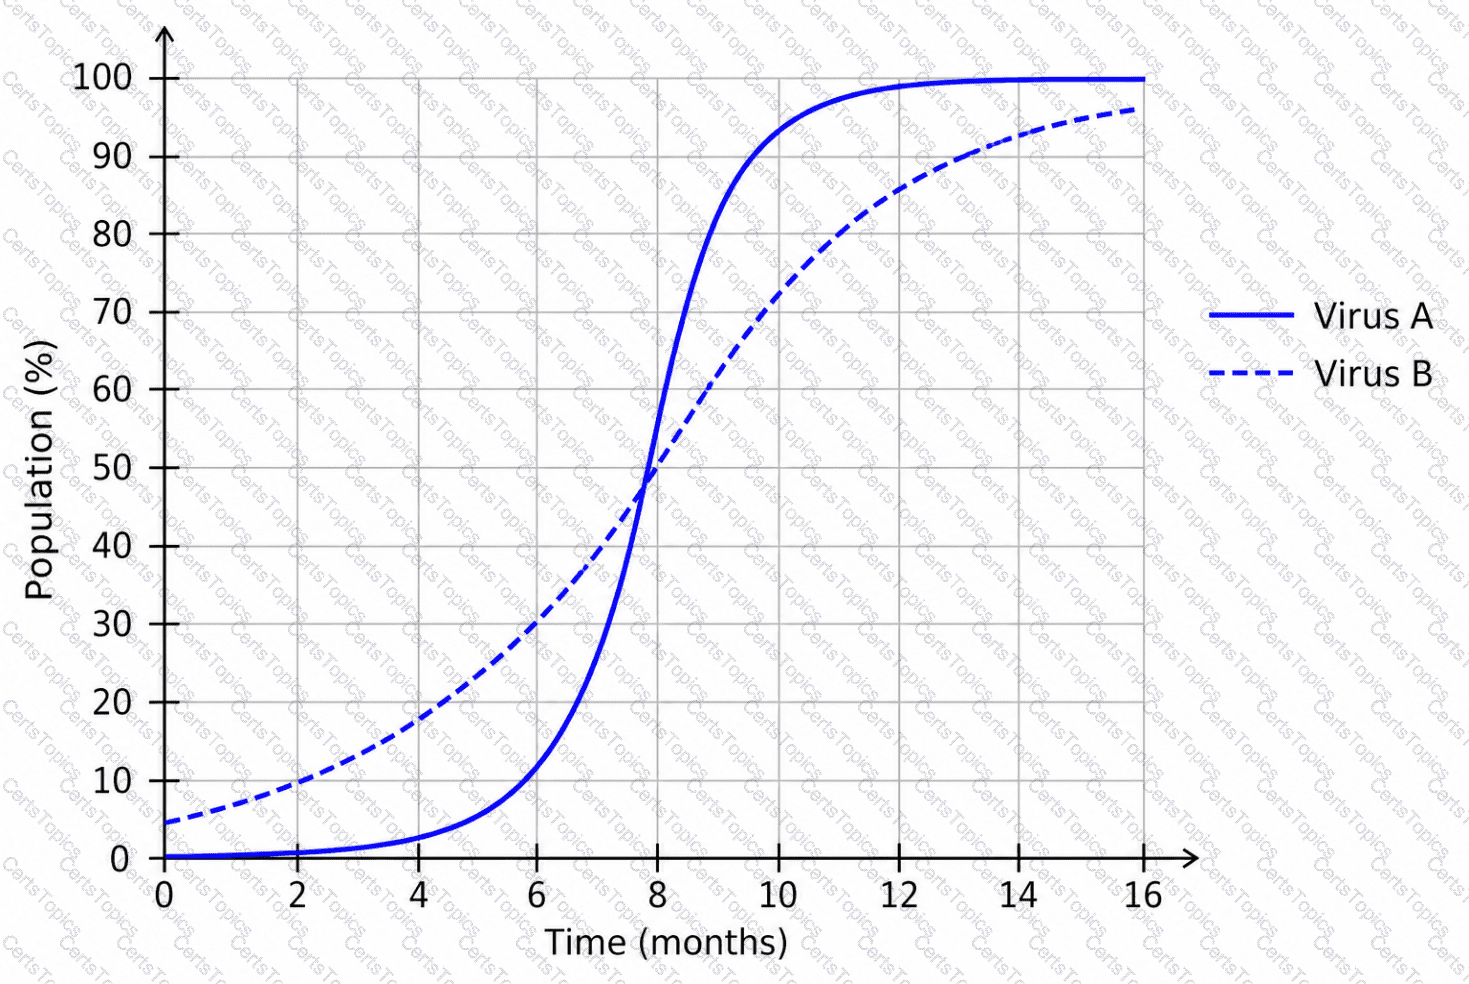
What is a correct conclusion based on the graph?
Copyright © 2021-2026 CertsTopics. All Rights Reserved
