
Summer Certification Sale 70% Discount Offer - Ends in 0d 00h 00m 00s - Coupon code: save70

WGU Applied-Algebra Based on Real Exam Environment

WGU Applied Algebra FXO2 PFXP C957 Questions and Answers

Question 25

The graph shows the progress of a manufacturing team, modeling the number of widgets the team is able to produce each day since the team was formed.
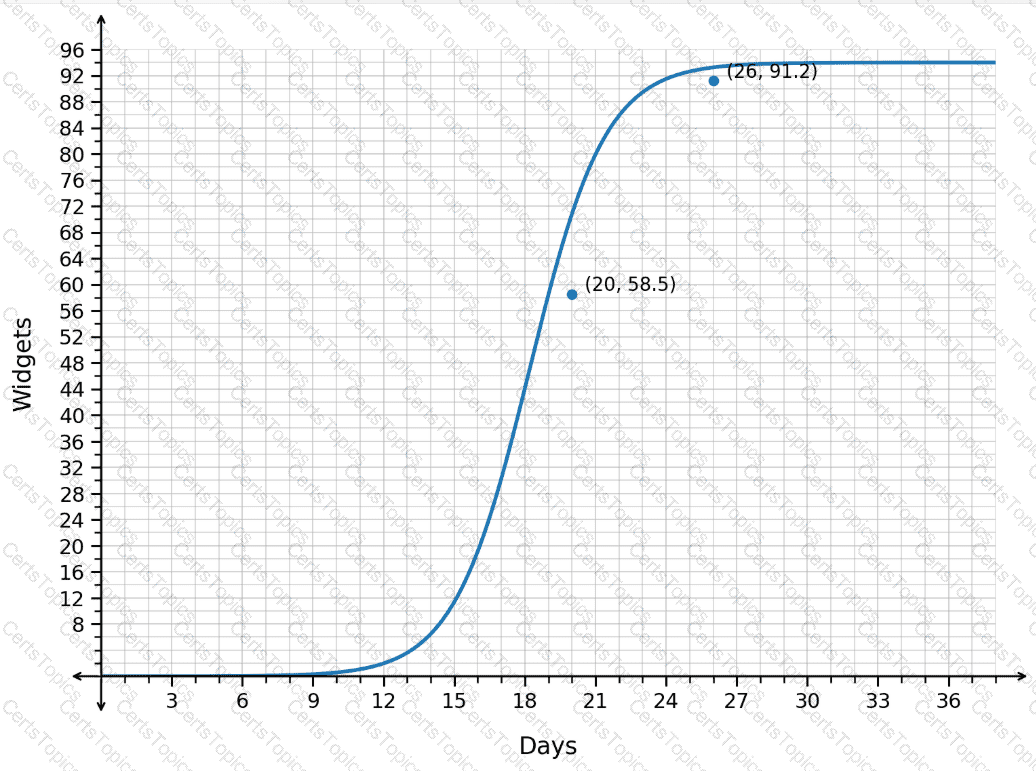
How should the average rate of change from day 20 to day 26 be interpreted?

Options:

A.

The team increased production by an average of approximately 5.5 widgets each day.

B.

The team increased production by an average of approximately 2.7 widgets each day.

C.

Over the 6-day period, the team approximately produced an additional 5.5 widgets in total.

D.

Over the 6-day period, the team approximately produced an additional 2.7 widgets in total.

Question 26

A researcher collected data on the average selling price for tickets to a concert over time. The results are shown in the scatterplot. A regression function is graphed with r

2

=0.56. The predicted average selling price for tickets after 10.8 days is $167.20.
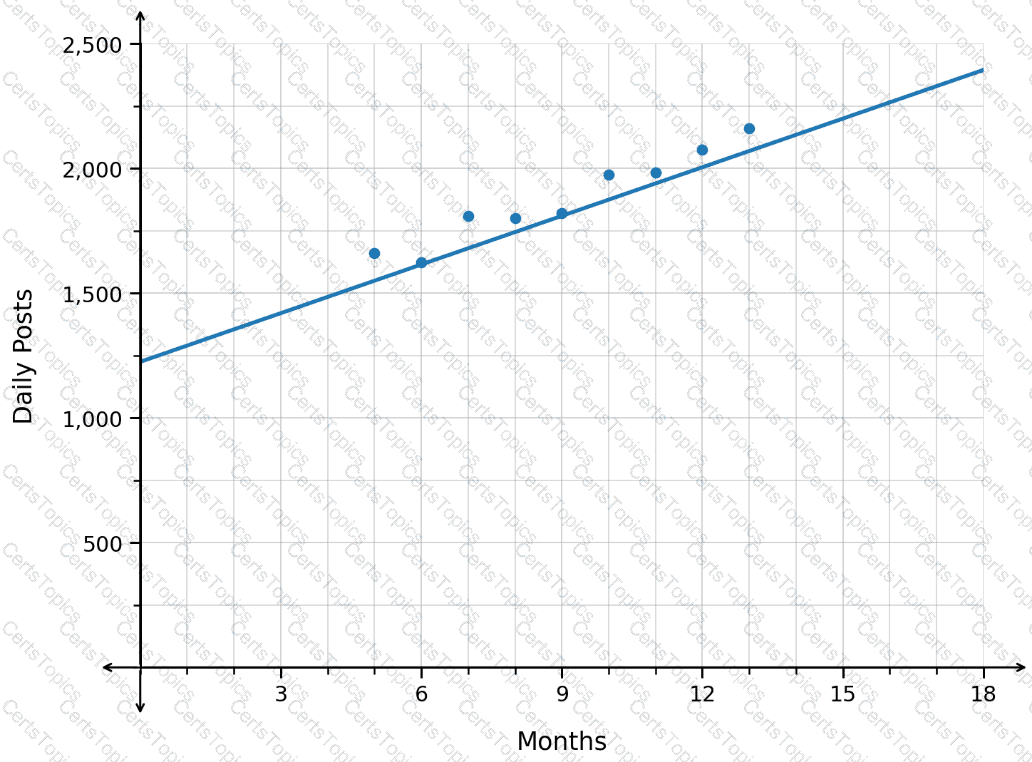
Is this prediction appropriate?

Options:

A.

Yes. The r

2

value indicates a strong fit, and x=10.8 is within 50% of the range of the maximum value.

B.

Yes. The r

2

value indicates a moderate fit, and x=10.8 is within 25% of the range of the maximum value.

C.

No. The r

2

value indicates a strong fit, but x=10.8 is more than 50% of the range beyond the maximum value.

D.

No. The r

2

value indicates a moderate fit, but x=10.8 is more than 25% of the range beyond the maximum value.

Question 27

A team was assembled at a manufacturing plant in order to boost productivity. The team was tasked with producing as many widgets each day as possible. The results are shown in the graph.
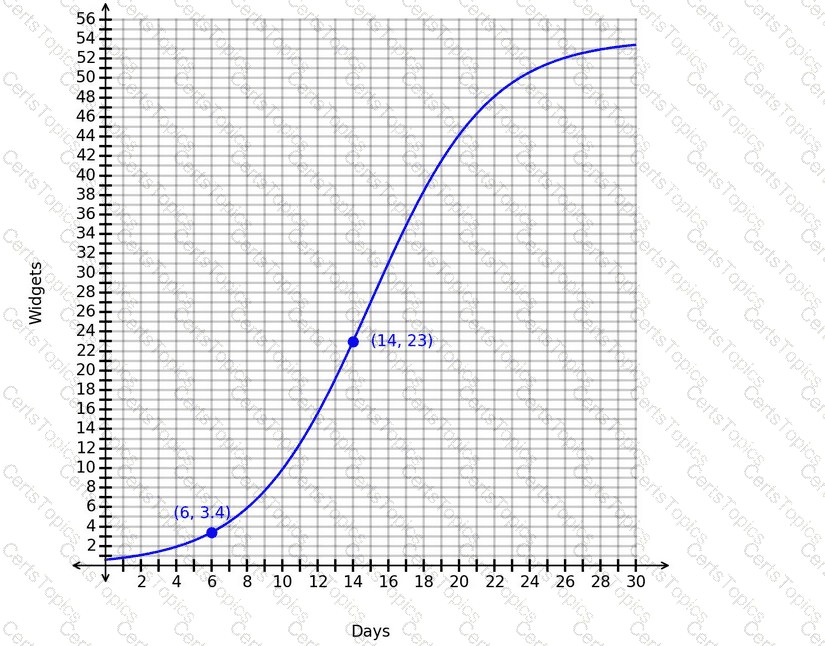
What is the correct interpretation of the average rate of change from day 6 to day 14?

Options:

A.

The team increased production by an average of approximately 1.2 widgets each day.

B.

The team increased production by an average of approximately 2.5 widgets each day.

C.

Over the 8-day period, the team approximately produced an additional 1.2 widgets in total.

D.

Over the 8-day period, the team approximately produced an additional 2.5 widgets in total.

Question 28

As regulations change, the number of licensed sellers of a product decreases. The graph models the change in the number of licensed sellers over time.
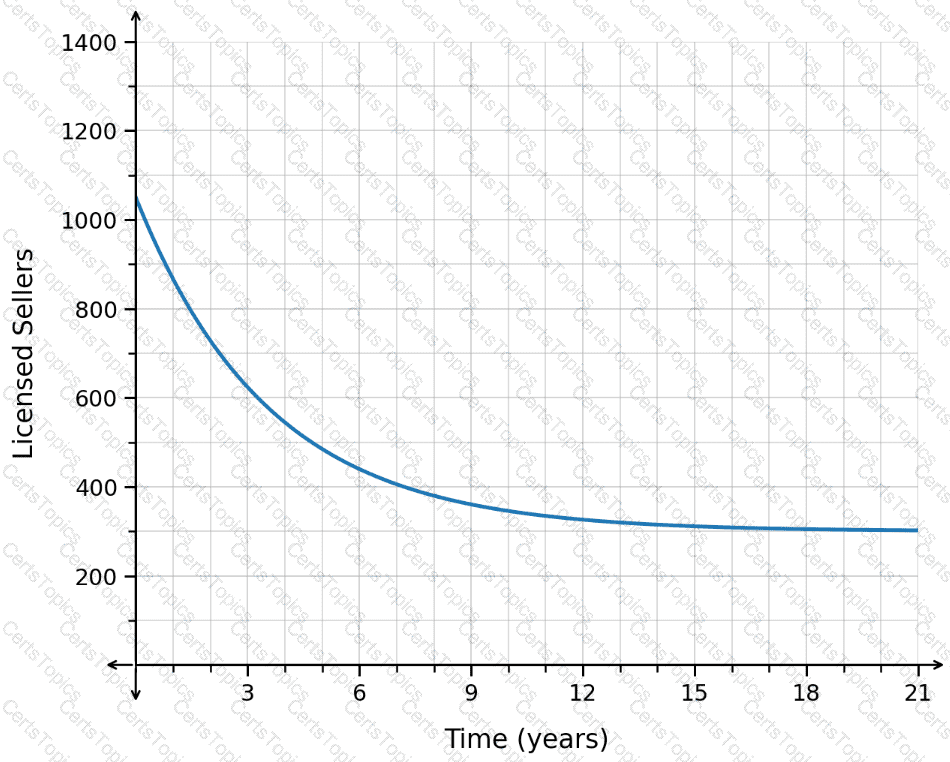
What does the horizontal asymptote mean?

Options:

A.

After 21 months, the number of licensed sellers decreased to 300.

B.

The number of licensed sellers was initially 1,050.

C.

In the long run, the number of licensed sellers nears 300.

D.

Over time, the number of licensed sellers will increase back up to 1,050.
