
Summer Certification Sale 70% Discount Offer - Ends in 0d 00h 00m 00s - Coupon code: save70

Passed Exam Today Applied-Algebra

WGU Applied Algebra FXO2 PFXP C957 Questions and Answers

Question 29

The values, in dollars, of two accounts over time are modeled by

A_1 (t)=6,500× 〖 1.05 〗 ^t

and

A_2 (t)=3,000× 〖 0.96 〗 ^t

The variable tis measured in years.

What is the difference between the accounts after 3 years?

Options:

A.

The value of Account 1 is about $4,870less than the value of Account 2.

B.

The value of Account 1 is about $2,654less than the value of Account 2.

C.

The value of Account 1 is about $4,870greater than the value of Account 2.

D.

The value of Account 1 is about $2,654greater than the value of Account 2.

Question 30

A researcher collected data on the number of members in a national association over time. The results are shown in the scatterplot. The graphed regression function has an r^2value of 0.54.
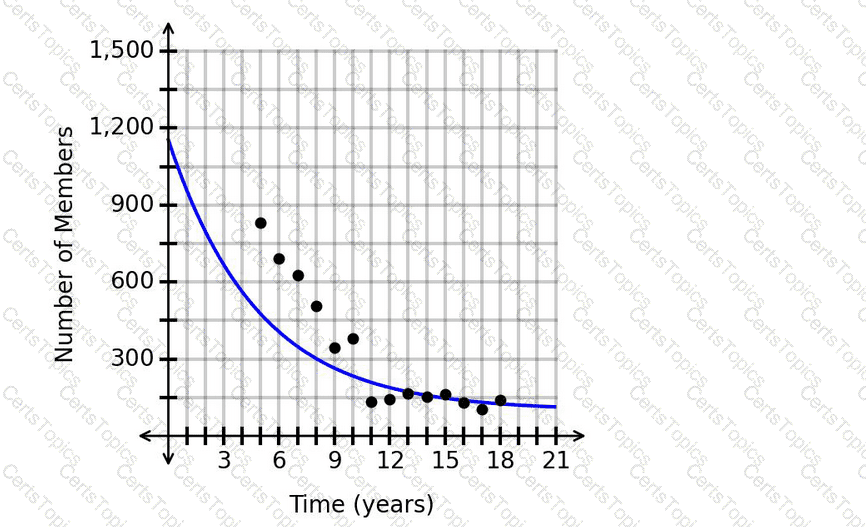
Is it appropriate to make a prediction for the number of members after 20.6years?

Options:

A.

No. The r^2value indicates a moderate fit, but x=20.6is more than 25%of the range beyond the maximum value.

B.

Yes. The r^2value indicates a strong fit, and x=20.6is within 50%of the range of the maximum value.

C.

Yes. The r^2value indicates a moderate fit, and x=20.6is within 25%of the range of the maximum value.

D.

No. The r^2value indicates a strong fit, but x=20.6is more than 50%of the range beyond the maximum value.

Question 31

A researcher collected data on the number of annual bear sightings in a region over time. The results are shown in the scatterplot. The graphed regression function has an r

2

value of 0.41. The predicted number of annual bear sightings after 19.4 years is 88.5.
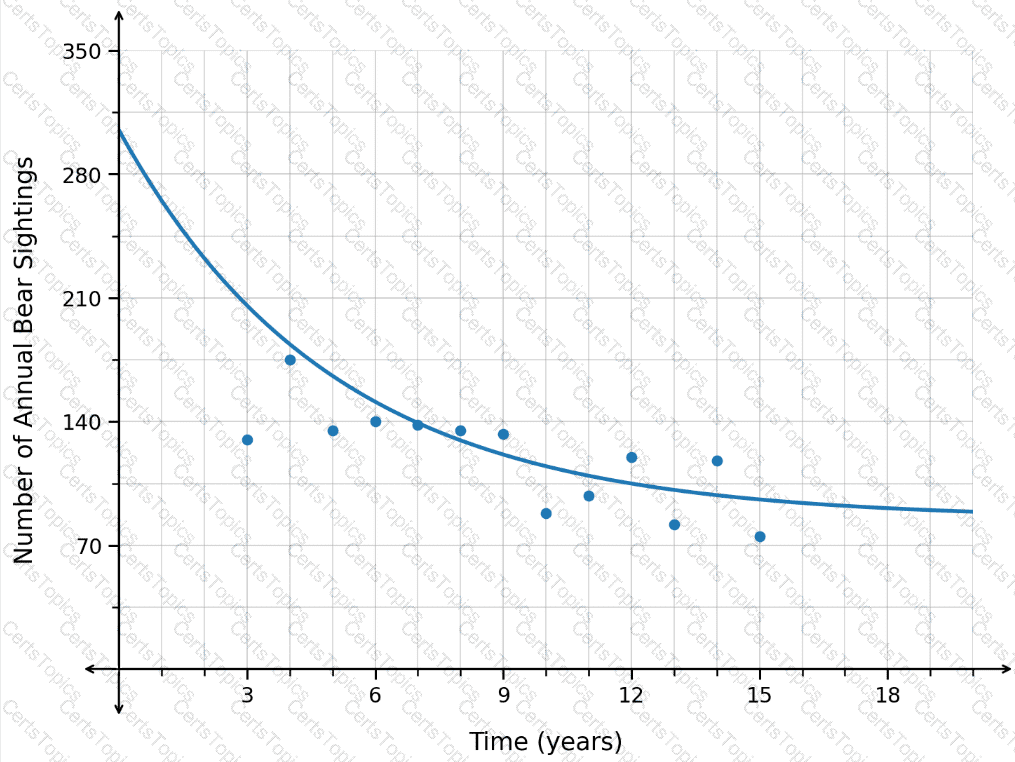
Is this prediction appropriate?

Options:

A.

Yes. The r

2

value indicates a strong fit, and x=19.4 is within 50% of the range of the maximum value.

B.

No. The r

2

value indicates a moderate fit, but x=19.4 is more than 25% of the range beyond the maximum value.

C.

Yes. The r

2

value indicates a moderate fit, and x=19.4 is within 25% of the range of the maximum value.

D.

No. The r

2

value indicates a strong fit, but x=19.4 is more than 50% of the range beyond the maximum value.

Question 32

A researcher collected data on the traffic frequency on a section of road. The results are shown in the scatterplot. A regression function is graphed with r^2=0.96. The predicted traffic frequency 16.2 hours after dawn is 70 cars per minute.
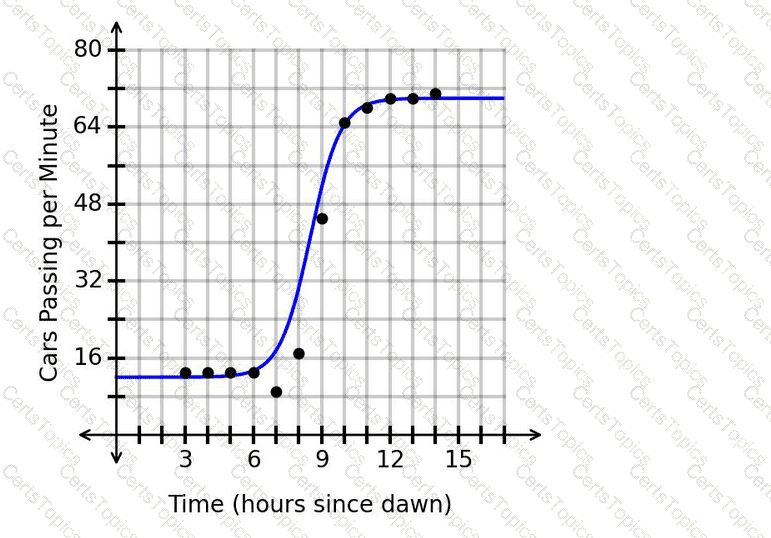
Is this prediction appropriate?

Options:

A.

Yes. The r^2value indicates a moderate fit, and x=16.2is within 25%of the range of the maximum value.

B.

No. The r^2value indicates a strong fit, but x=16.2is more than 50%of the range beyond the maximum value.

C.

Yes. The r^2value indicates a strong fit, and x=16.2is within 50%of the range of the maximum value.

D.

No. The r^2value indicates a moderate fit, but x=16.2is more than 25%of the range beyond the maximum value.
