The logistic function f(x), whose graph is shown, models the number of people who have created a website account, where xrepresents the number of days since the website started and f(x)represents the number of people who have created an account.
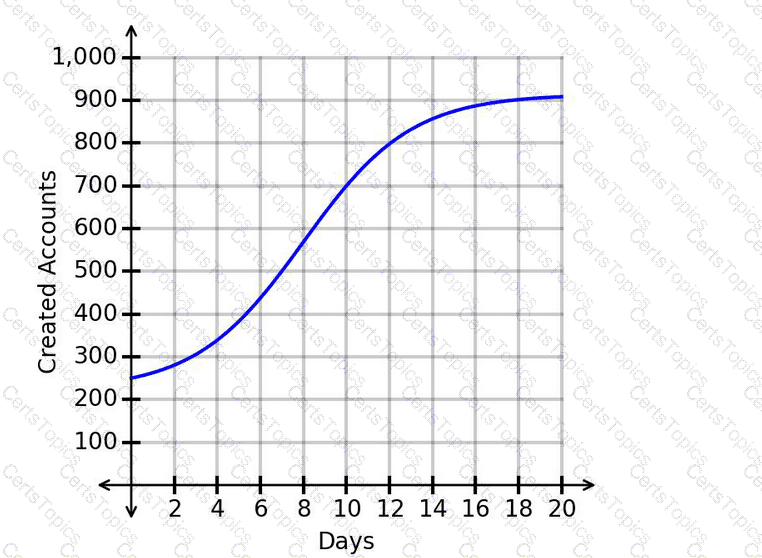
What is one range of values for which the graph is concave down?
The graphed function n(t)represents the number of animals, n, at a feeding station thours after 5:00 a.m. The plotted points Aand Bhave coordinates (1│10.6)and (8│6.59).
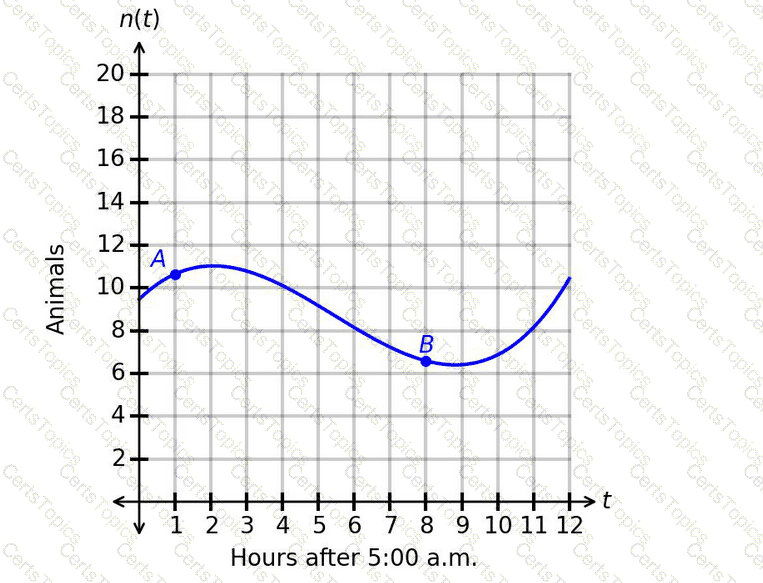
Which statement gives the correct interpretation of the average rate of change of the number of animals over the interval from point Ato point B?
As sacks are unloaded off a wagon, the total weight of the wagon and sacks changes. Each sack has the same weight. After 5 sacks are removed, the total weight of the wagon and remaining sacks is 135 pounds. After 9 sacks are removed, the total weight is 87 pounds. What is the weight of each sack?
The number of property sales in a region this year is expected to be 9 more than the number of property sales in the region last year. The function H(x) represents the number of property sales this year, where x represents the number of properties sold last year.
Which notation represents the number of property sales this year, given that the number of properties sold last year was 140?
Copyright © 2021-2026 CertsTopics. All Rights Reserved
