
The scatterplot shows data on the number of visitors to a resort each week since opening. A regression function is graphed with r^2=0.99. The predicted number of visitors after 16.4weeks is 38.6.
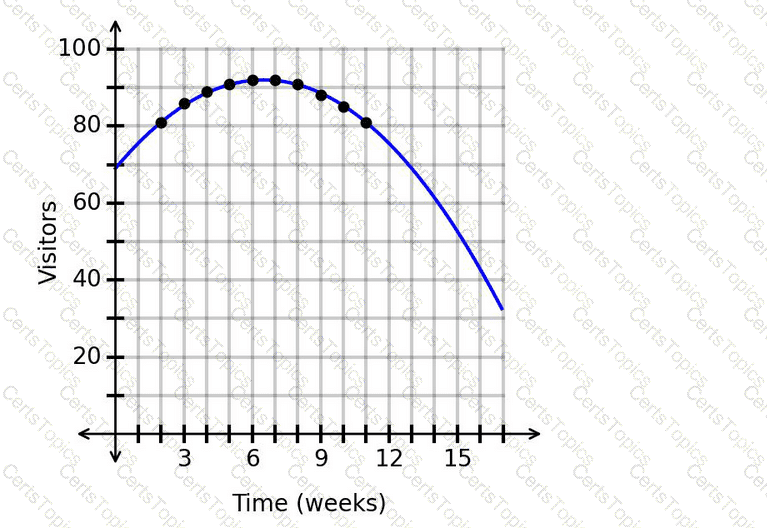
Is this prediction appropriate?
The function f(n) represents the relationship between the distances traveled by two vehicles, where n is the distance traveled by vehicle A and f is the distance traveled by vehicle B. The distance traveled by vehicle B is 17 more than the distance traveled by vehicle A.
Which function represents this situation?
Consider the function I(m)=41m²−490m+30, which represents the daily income, I, in dollars, of a store based on the number of months, m, since the beginning of the year. What is the difference between I(7) and I(9)?
In the graph showing the number of new customer accounts, the horizontal axis shows the number of weeks since the beginning of winter and the vertical axis shows the number of new customer accounts. More customer accounts are opened during snowy weeks than during weeks without snow.
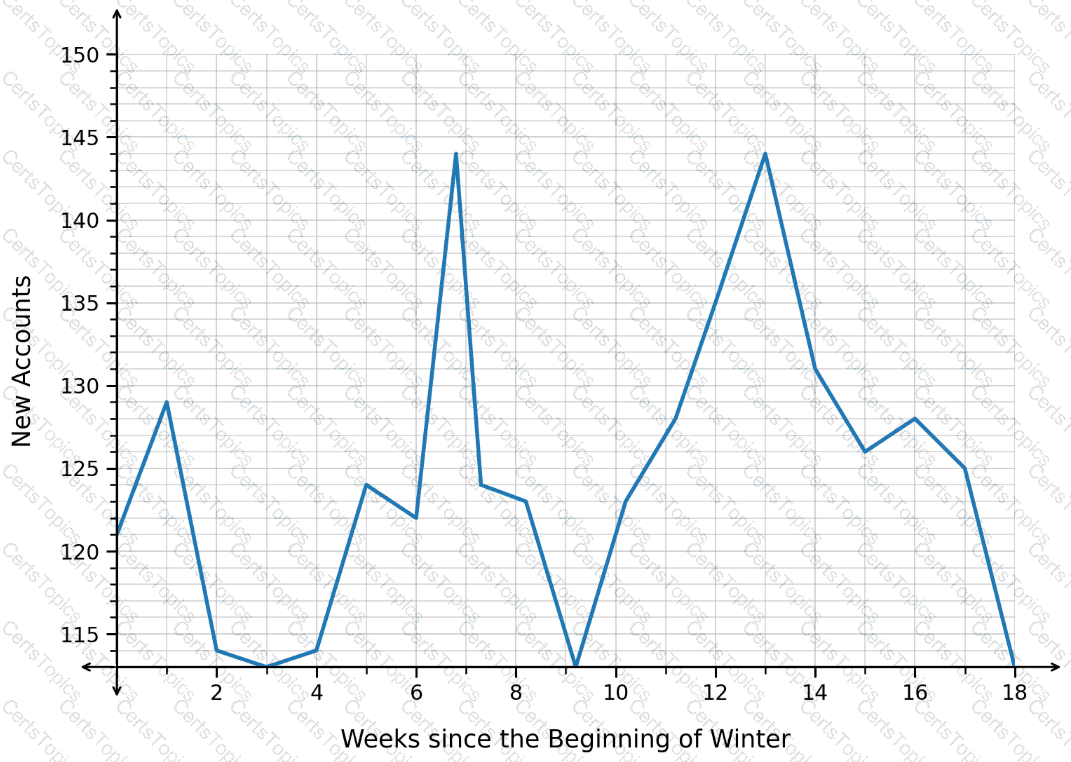
When was it likely snowy?
Copyright © 2021-2026 CertsTopics. All Rights Reserved
