Verified By IT Certified Experts
CertsTopics.com Certified Safe Files
Up-To-Date Exam Study Material
99.5% High Success Pass Rate
100% Accurate Answers
Instant Downloads
Exam Questions And Answers PDF
Try Demo Before You Buy


An investment account accrues interest every year, and the value of the account is given by G(x). The graph of this function is shown.
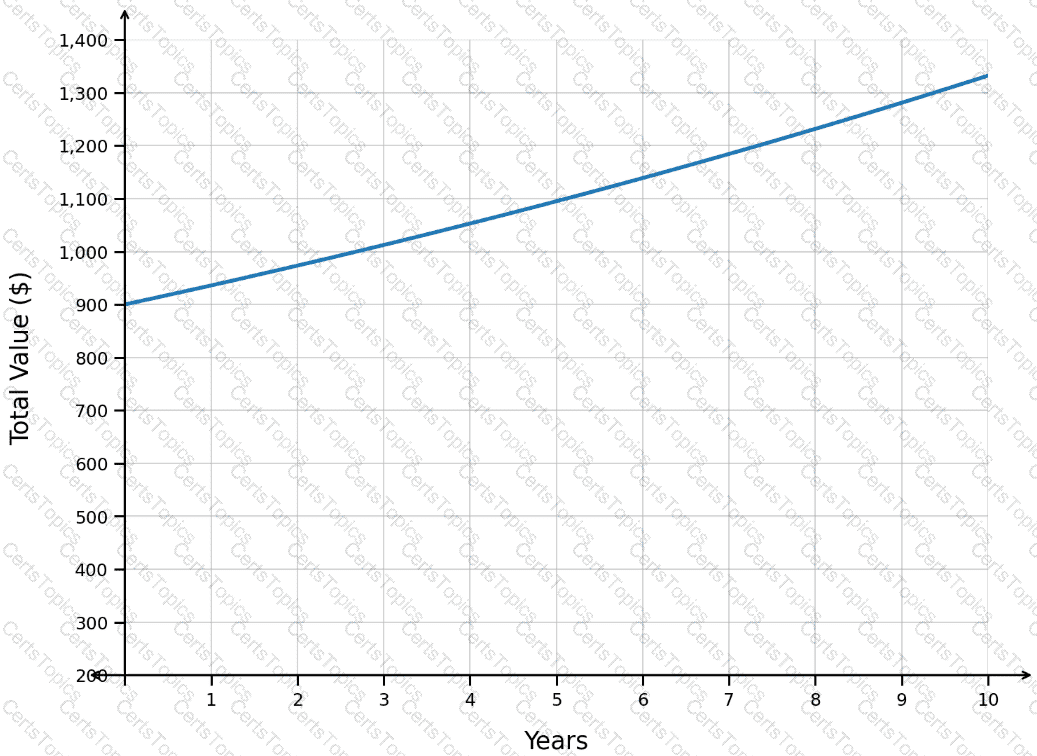
What represents the value of the account after 4 years?
The exponential function
f(t)=2900(1.13)
t
represents the size of a bacteria population, where t is the time in hours.
How many bacteria are in the population when t=18?
The graph shows the daily practice duration for a musician, where the number of days since the beginning of the month is along the horizontal axis and the number of minutes practiced per day is along the vertical axis.
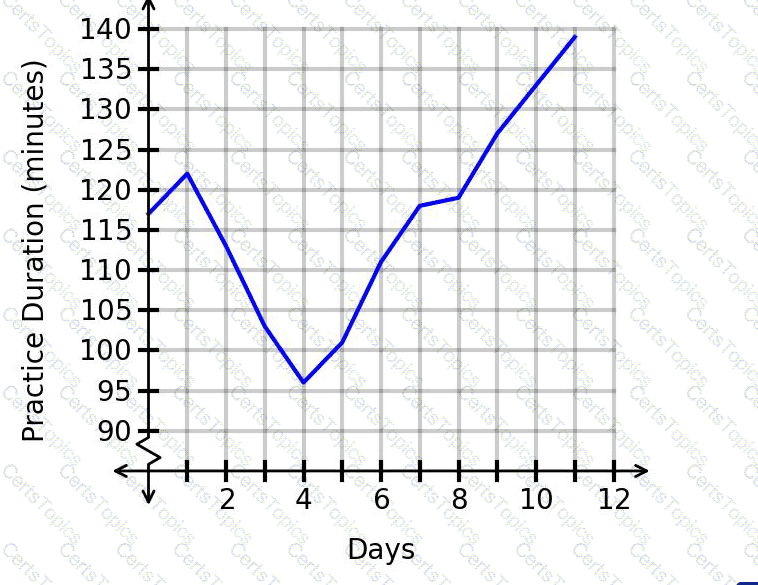
What was the practice duration for day 9, based on the graph?
Copyright © 2021-2026 CertsTopics. All Rights Reserved
