You are working with a government agency that requires you to archive application logs for seven years. You need to configure Stackdriver to export and store the logs while minimizing costs of storage. What should you do?
Your company wants to implement a CD pipeline in Cloud Deploy for a web service deployed to GKE. The web service currently does not have any automated testing. The Quality Assurance team must manually verify any new releases of the web service before any production traffic is processed. You need to design the CD pipeline. What should you do?
You are managing an MLOps platform on a Google Kubernetes Engine (GKE) cluster that serves two teams:
The Research team runs hundreds of small, daily experiments that can run as capacity allows and are highly cost-sensitive.
The Production team must retrain the company's main language model every Friday at 10:00 PM. This job is business-critical, cannot be interrupted, and must start on time.
You need to configure the modes for Dynamic Workload Scheduler to meet each team's requirements. What should you do?
You are deploying a Cloud Build job that deploys Terraform code when a Git branch is updated. While testing, you noticed that the job fails. You see the following error in the build logs:
Initializing the backend. ..
Error: Failed to get existing workspaces : querying Cloud Storage failed: googleapi : Error
403
You need to resolve the issue by following Google-recommended practices. What should you do?
You are the Site Reliability Engineer responsible for managing your company's data services and products. You regularly navigate operational challenges, such as unpredictable data volume and high cost, with your company's data ingestion processes. You recently learned that a new data ingestion product will be developed in Google Cloud. You need to collaborate with the product development team to provide operational input on the new product. What should you do?
Your application artifacts are being built and deployed via a CI/CD pipeline. You want the CI/CD pipeline to securely access application secrets. You also want to more easily rotate secrets in case of a security breach. What should you do?
You are running a real-time gaming application on Compute Engine that has a production and testing environment. Each environment has their own Virtual Private Cloud (VPC) network. The application frontend and backend servers are located on different subnets in the environment's VPC. You suspect there is a malicious process communicating intermittently in your production frontend servers. You want to ensure that network traffic is captured for analysis. What should you do?
You manage an application that is writing logs to Stackdriver Logging. You need to give some team members the ability to export logs. What should you do?
You support a web application that is hosted on Compute Engine. The application provides a booking service for thousands of users. Shortly after the release of a new feature, your monitoring dashboard shows that all users are experiencing latency at login. You want to mitigate the impact of the incident on the users of your service. What should you do first?
You are managing an application that exposes an HTTP endpoint without using a load balancer. The latency of the HTTP responses is important for the user experience. You want to understand what HTTP latencies all of your users are experiencing. You use Stackdriver Monitoring. What should you do?
You need to define Service Level Objectives (SLOs) for a high-traffic multi-region web application. Customers expect the application to always be available and have fast response times. Customers are currently happy with the application performance and availability. Based on current measurement, you observe that the 90th percentile of latency is 120ms and the 95th percentile of latency is 275ms over a 28-day window. What latency SLO would you recommend to the team to publish?
Your team deploys applications to three Google Kubernetes Engine (GKE) environments development staging and production You use GitHub reposrtones as your source of truth You need to ensure that the three environments are consistent You want to follow Google-recommended practices to enforce and install network policies and a logging DaemonSet on all the GKE clusters in those environments What should you do?
You have a pool of application servers running on Compute Engine. You need to provide a secure solution that requires the least amount of configuration and allows developers to easily access application logs for troubleshooting. How would you implement the solution on GCP?
You need to introduce postmortems into your organization during the holiday shopping season. You are expecting your web application to receive a large volume of traffic in a short period. You need to prepare your application for potential failures during the event What should you do?
Choose 2 answers
You recently created a Cloud Build pipeline for deploying Terraform code stored in a GitHub repository. You make Terraform code changes in short-lived branches and sometimes use tags during development. You tag releases with a semantic version when they are ready for deployment. You require your pipeline to apply the Terraform code whenever there is a new release, and you need to minimize operational overhead. What should you do?
Your company follows Site Reliability Engineering principles. You are writing a postmortem for an incident, triggered by a software change, that severely affected users. You want to prevent severe incidents from happening in the future. What should you do?
Your application services run in Google Kubernetes Engine (GKE). You want to make sure that only images from your centrally-managed Google Container Registry (GCR) image registry in the altostrat-images project can be deployed to the cluster while minimizing development time. What should you do?
Your organization wants to collect system logs that will be used to generate dashboards in Cloud Operations for their Google Cloud project. You need to configure all current and future Compute Engine instances to collect the system logs and you must ensure that the Ops Agent remains up to date. What should you do?
Your application images are built and pushed to Google Container Registry (GCR). You want to build an automated pipeline that deploys the application when the image is updated while minimizing the development effort. What should you do?
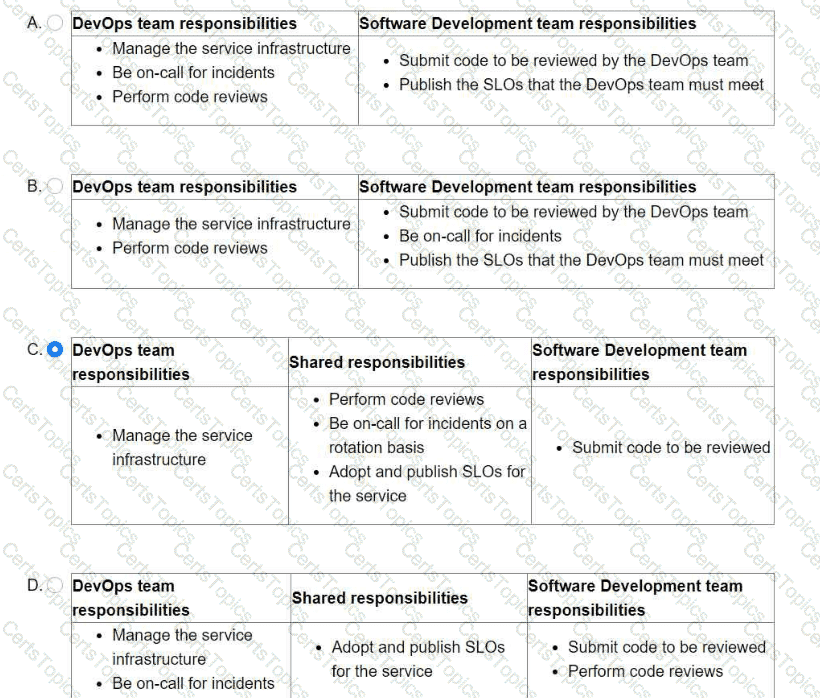
You are leading a DevOps project for your organization. The DevOps team is responsible for managing the service infrastructure and being on-call for incidents. The Software Development team is responsible for writing, submitting, and reviewing code. Neither team has any published SLOs. You want to design a new joint-ownership model for a service between the DevOps team and the Software Development team. Which responsibilities should be assigned to each team in the new joint-ownership model?
You have a set of applications running on a Google Kubernetes Engine (GKE) cluster, and you are using Stackdriver Kubernetes Engine Monitoring. You are bringing a new containerized application required by your company into production. This application is written by a third party and cannot be modified or reconfigured. The application writes its log information to /var/log/app_messages.log, and you want to send these log entries to Stackdriver Logging. What should you do?
You are performing a semiannual capacity planning exercise for your flagship service. You expect a service user growth rate of 10% month-over-month over the next six months. Your service is fully containerized and runs on Google Cloud Platform (GCP). using a Google Kubernetes Engine (GKE) Standard regional cluster on three zones with cluster autoscaler enabled. You currently consume about 30% of your total deployed CPU capacity, and you require resilience against the failure of a zone. You want to ensure that your users experience minimal negative impact as a result of this growth or as a result of zone failure, while avoiding unnecessary costs. How should you prepare to handle the predicted growth?
Your company has recently experienced several production service issues. You need to create a Cloud Monitoring dashboard to troubleshoot the issues, and you want to use the dashboard to distinguish between failures in your own service and those caused by a Google Cloud service that you use. What should you do?
A third-party application needs to have a service account key to work properly When you try to export the key from your cloud project you receive an error "The organization policy constraint larn.disableServiceAccountKeyCreation is enforcedM You need to make the third-party application work while following Google-recommended security practices What should you do?
You support a production service that runs on a single Compute Engine instance. You regularly need to spend time on recreating the service by deleting the crashing instance and creating a new instance based on the relevant image. You want to reduce the time spent performing manual operations while following Site Reliability Engineering principles. What should you do?
You support a multi-region web service running on Google Kubernetes Engine (GKE) behind a Global HTTP'S Cloud Load Balancer (CLB). For legacy reasons, user requests first go through a third-party Content Delivery Network (CDN). which then routes traffic to the CLB. You have already implemented an availability Service Level Indicator (SLI) at the CLB level. However, you want to increase coverage in case of a potential load balancer misconfiguration. CDN failure, or other global networking catastrophe. Where should you measure this new SLI?
Choose 2 answers
You need to run a business-critical workload on a fixed set of Compute Engine instances for several months. The workload is stable with the exact amount of resources allocated to it. You want to lower the costs for this workload without any performance implications. What should you do?
You encounter a large number of outages in the production systems you support. You receive alerts for all the outages that wake you up at night. The alerts are due to unhealthy systems that are automatically restarted within a minute. You want to set up a process that would prevent staff burnout while following Site Reliability Engineering practices. What should you do?
The new version of your containerized application has been tested and is ready to be deployed to production on Google Kubernetes Engine (GKE) You could not fully load-test the new version in your pre-production environment and you need to ensure that the application does not have performance problems after deployment Your deployment must be automated What should you do?
You have an application that runs on Cloud Run. You want to use live production traffic to test a new version of the application while you let the quality assurance team perform manual testing. You want to limit the potential impact of any issues while testing the new version, and you must be able to roll back to a previous version of the application if needed. How should you deploy the new version?
Choose 2 answers
You deploy a new release of an internal application during a weekend maintenance window when there is minimal user traffic. After the window ends, you learn that one of the new features isn't working as expected in the production environment. After an extended outage, you roll back the new release and deploy a fix. You want to modify your release process to reduce the mean time to recovery so you can avoid extended outages in the future. What should you do?
Choose 2 answers
You are configuring your CI/CD pipeline natively on Google Cloud. You want builds in a pre-production Google Kubernetes Engine (GKE) environment to be automatically load-tested before being promoted to the production GKE environment. You need to ensure that only builds that have passed this test are deployed to production. You want to follow Google-recommended practices. How should you configure this pipeline with Binary Authorization?
You are performing a semi-annual capacity planning exercise for your flagship service You expect a service user growth rate of 10% month-over-month for the next six months Your service is fully containerized and runs on a Google Kubemetes Engine (GKE) standard cluster across three zones with cluster autoscaling enabled You currently consume about 30% of your total deployed CPU capacity and you require resilience against the failure of a zone. You want to ensure that your users experience minimal negative impact as a result of this growth o' as a result of zone failure while you avoid unnecessary costs How should you prepare to handle the predicted growth?
You encountered a major service outage that affected all users of the service for multiple hours. After several hours of incident management, the service returned to normal, and user access was restored. You need to provide an incident summary to relevant stakeholders following the Site Reliability Engineering recommended practices. What should you do first?
You support a Node.js application running on Google Kubernetes Engine (GKE) in production. The application makes several HTTP requests to dependent applications. You want to anticipate which dependent applications might cause performance issues. What should you do?
You are writing a postmortem for an incident that severely affected users. You want to prevent similar incidents in the future. Which two of the following sections should you include in the postmortem? (Choose two.)
You use Spinnaker to deploy your application and have created a canary deployment stage in the pipeline. Your application has an in-memory cache that loads objects at start time. You want to automate the comparison of the canary version against the production version. How should you configure the canary analysis?
Your organization recently adopted a container-based workflow for application development. Your team develops numerous applications that are deployed continuously through an automated build pipeline to a Kubernetes cluster in the production environment. The security auditor is concerned that developers or operators could circumvent automated testing and push code changes to production without approval. What should you do to enforce approvals?
Your organization wants to increase the availability target of an application from 99 9% to 99 99% for an investment of $2 000 The application's current revenue is S1,000,000 You need to determine whether the increase in availability is worth the investment for a single year of usage What should you do?
Your company follows Site Reliability Engineering practices. You are the person in charge of Communications for a large, ongoing incident affecting your customer-facing applications. There is still no estimated time for a resolution of the outage. You are receiving emails from internal stakeholders who want updates on the outage, as well as emails from customers who want to know what is happening. You want to efficiently provide updates to everyone affected by the outage. What should you do?
Your company stores a large volume of infrequently used data in Cloud Storage. The projects in your company's CustomerService folder access Cloud Storage frequently, but store very little data. You want to enable Data Access audit logging across the company to identify data usage patterns. You need to exclude the CustomerService folder projects from Data Access audit logging. What should you do?
You manage an application that runs in Google Kubernetes Engine (GKE) and uses the blue/green deployment methodology Extracts of the Kubernetes manifests are shown below:
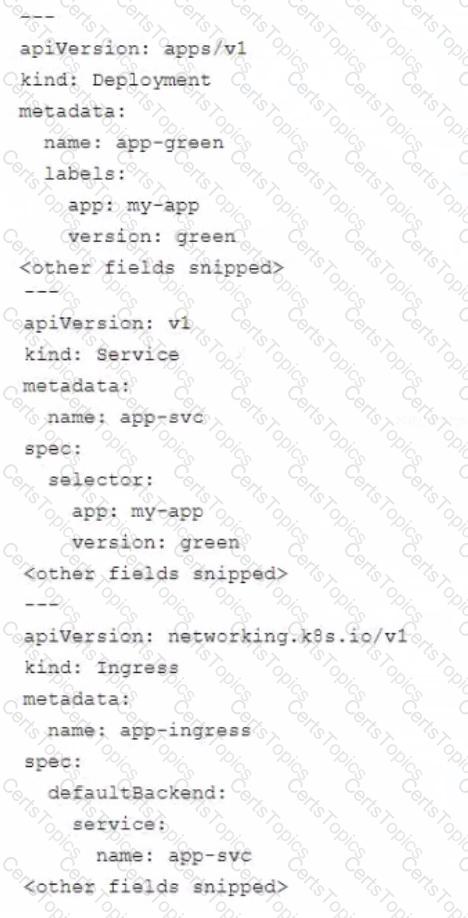
The Deployment app-green was updated to use the new version of the application During post-deployment monitoring you notice that the majority of user requests are failing You did not observe this behavior in the testing environment You need to mitigate the incident impact on users and enable the developers to troubleshoot the issue What should you do?
You work for a healthcare company and regulations require you to create all resources in a United States-based region. You attempted to create a secret in Secret Manager but received the following error message:
The resource cannot be created in the global location due to an organization policy restriction.
You need to resolve the error while remaining compliant with regulations. What should you do?
You are responding to a high-priority incident where a critical, user-facing payment service is experiencing a 50% error rate. The cause is a non-critical, batch analytics Dataflow pipeline flooding a shared Memorystore for Redis instance with writes, which has spiked read latency for the payment service. A full rollback of the Dataflow pipeline's deployment will take 15 minutes to complete through your CI/CD process. You need to restore the payment service as quickly as possible. What should you do?
Your company runs an e-commerce business. The application responsible for payment processing has structured JSON logging with the following schema:
Capture and access of logs from the payment processing application is mandatory for operations, but the jsonPayload.user_email field contains personally identifiable information (PII). Your security team does not want the entire engineering team to have access to PII. You need to stop exposing PII to the engineering team and restrict access to security team members only. What should you do?
You support a service with a well-defined Service Level Objective (SLO). Over the previous 6 months, your service has consistently met its SLO and customer satisfaction has been consistently high. Most of your service’s operations tasks are automated and few repetitive tasks occur frequently. You want to optimize the balance between reliability and deployment velocity while following site reliability engineering best practices. What should you do? (Choose two.)
You are using Stackdriver to monitor applications hosted on Google Cloud Platform (GCP). You recently deployed a new application, but its logs are not appearing on the Stackdriver dashboard.
You need to troubleshoot the issue. What should you do?
Your team has an application built by using a Dockerfile. The build is executed from Cloud Build, and the resulting artifacts are stored in Artifact Registry. Your team is reporting that builds are slow. You need to increase build speed, while following Google-recommended practices. What should you do?
You manage a retail website for your company. The website consists of several microservices running in a GKE Standard node pool with node autoscaling enabled. Each microservice has resource limits and a Horizontal Pod Autoscaler configured. During a busy period, you receive alerts for one of the microservices. When you check the Pods, half of them have the status OOMKilled, and the number of Pods is at the minimum autoscaling limit. You need to resolve the issue. What should you do?
You are developing the deployment and testing strategies for your CI/CD pipeline in Google Cloud You must be able to
• Reduce the complexity of release deployments and minimize the duration of deployment rollbacks
• Test real production traffic with a gradual increase in the number of affected users
You want to select a deployment and testing strategy that meets your requirements What should you do?
You are developing reusable infrastructure as code modules. Each module contains integration tests that launch the module in a test project. You are using GitHub for source control. You need to Continuously test your feature branch and ensure that all code is tested before changes are accepted. You need to implement a solution to automate the integration tests. What should you do?
As part of your company's initiative to shift left on security, the infoSec team is asking all teams to implement guard rails on all the Google Kubernetes Engine (GKE) clusters to only allow the deployment of trusted and approved images You need to determine how to satisfy the InfoSec teams goal of shifting left on security. What should you do?
You are investigating issues in your production application that runs on Google Kubernetes Engine (GKE). You determined that the source Of the issue is a recently updated container image, although the exact change in code was not identified. The deployment is currently pointing to the latest tag. You need to update your cluster to run a version of the container that functions as intended. What should you do?
You have an application that runs in Google Kubernetes Engine (GKE). The application consists of several microservices that are deployed to GKE by using Deployments and Services One of the microservices is experiencing an issue where a Pod returns 403 errors after the Pod has been running for more than five hours Your development team is working on a solution but the issue will not be resolved for a month You need to ensure continued operations until the microservice is fixed You want to follow Google-recommended practices and use the fewest number of steps What should you do?
You manage a critical, user-facing application and have configured a service level objective (SLO) in Cloud Monitoring to track 99% availability over a 30-day rolling window. Recently, a series of minor issues have increased latency, causing the error budget to be consumed at an accelerated rate. You need to be proactively notified when the service is at risk of violating its SLO before the error budget is fully depleted. What should you do?
You are building the Cl/CD pipeline for an application deployed to Google Kubernetes Engine (GKE) The application is deployed by using a Kubernetes Deployment, Service, and Ingress The application team asked you to deploy the application by using the blue'green deployment methodology You need to implement the rollback actions What should you do?
You are running an experiment to see whether your users like a new feature of a web application. Shortly after deploying the feature as a canary release, you receive a spike in the number of 500 errors sent to users, and your monitoring reports show increased latency. You want to quickly minimize the negative impact on users. What should you do first?
You work for a global organization and run a service with an availability target of 99% with limited engineering resources. For the current calendar month you noticed that the service has 99 5% availability. You must ensure that your service meets the defined availability goals and can react to business changes including the upcoming launch of new features You also need to reduce technical debt while minimizing operational costs You want to follow Google-recommended practices What should you do?
Copyright © 2021-2026 CertsTopics. All Rights Reserved
