EMC Related Exams
D-DS-FN-23 Exam


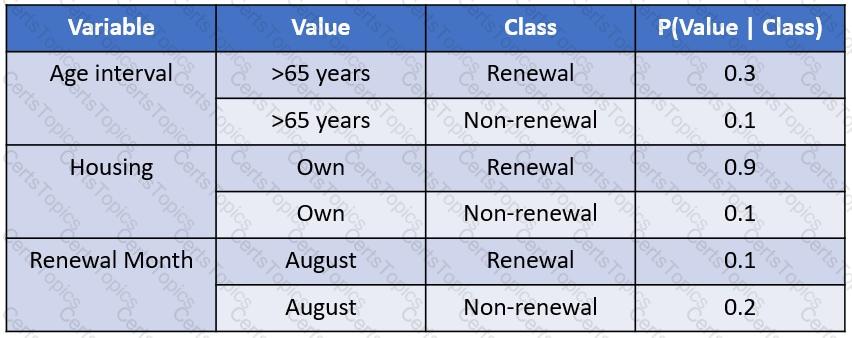
Refer to the exhibit.
To predict whether or not a customer will renew their annual property insurance policy, an insurance company built and operationalized a naïve Bayes classification model. In the model, there are two class labels, renewal and non-renewal, that are assigned to each customer based on their attributes.
A subset of the key attributes, their values, and corresponding conditional probabilities are provided in the exhibit.
A customer has the following attributes:
● Age is greater than 65 years
● Owns their own home
● Renewal month is August
If 20% of customers do not renew the police every year, what is the score for a renewal in the naïve Bayesian model for the customer described above?

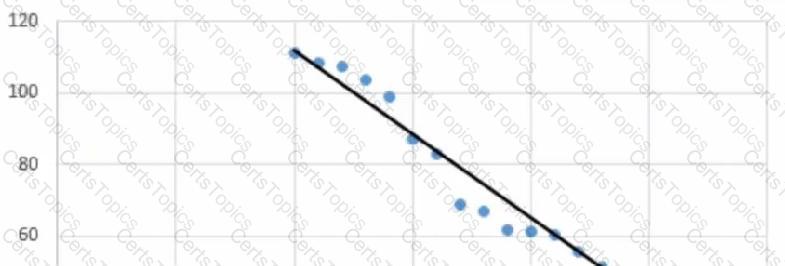
Refer to the exhibit.
What is the approximate R-squared value for a linear regression model fitted to the data associated with this scatterplot?