
A Data Analyst decides to add custom shapes to some key performance indicators (KPIs) in order to indicate their performance.
How should the analyst make the custom shapes available in a workbook?
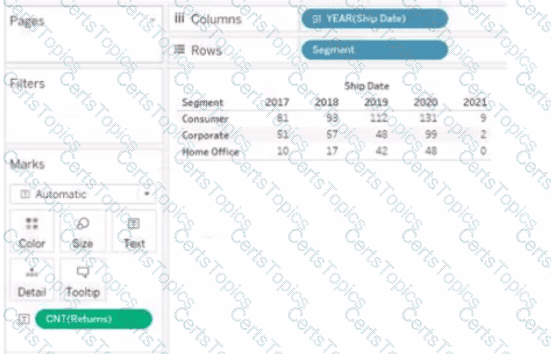
You have the following visualization.

A Data Analyst has a data source that has two tables named Table1 and Table2. Table1 is the primary table and Table2 is the secondary table.
The analyst wants to combine the tables by using Tableau Prep. The combined table must include only values from Table1 that do not match any values in Table2. The field values from Table2 must appear as null values.
Which type of join should the analyst use?
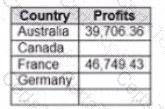
You have the following dataset that contain null values in the Profits field.
You want the data to appear as shown in the following table.
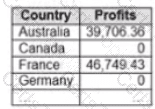
Which two formulas achieve the goal? Choose two.
Copyright © 2021-2026 CertsTopics. All Rights Reserved

