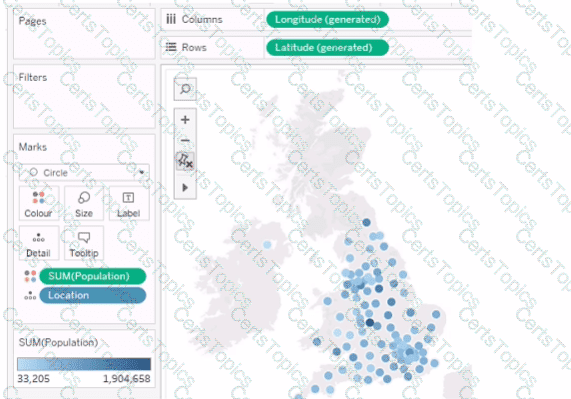
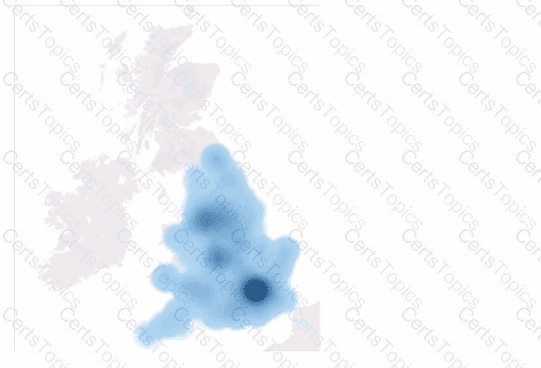
The question presents a scenario where a geographic map visualization in Tableau needs to be transformed from a series of discrete circles representing data points to a density map visualization. The density map shows concentrations of data points with a gradient of color, where denser areas are indicated by a darker color.
Here ' s the explanation for each option:
A. Change the mark type to Density: This is the correct answer because changing the mark type to ' Density ' in Tableau creates a density map, which displays the concentration of data points with a color gradient. This is exactly what is needed to achieve the visual effect shown in the second image, where regions with a higher concentration of data points are represented by darker shades.
B. Drag Location to Size on the Marks card: This option would adjust the size of the marks based on the number of locations, which is not relevant to creating a density map. It would result in varying sizes of circles, not a continuous gradient.
C. Change the mark type to Map: The visualization is already using a map. This option would not change the visualization to the desired density map.
D. Drag Population to Size on the Marks card: This would change the size of the circles based on the population values, making some circles larger and others smaller. This is not how a density map is created, which uses color intensity rather than size to show concentration.
E. Change the opacity to 75%: Changing the opacity would affect the transparency of the marks on the map but would not transform the visualization into a density map.
To achieve the visualization shown in the second image, the mark type must be changed to ' Density, ' which will produce a heat map-like effect where the color intensity represents the concentration of data points. Therefore, the correct answer is A. Change the mark type to Density .
To create a density map from a scatter plot of data points, you would change the mark type to Density. This mark type allows you to visualize the concentration of data points in an area, which can be useful for identifying clusters or patterns in geospatial data.