Pre-Winter Sale 70% Discount Offer - Ends in 0d 00h 00m 00s - Coupon code: save70

Exactprep Analytics-DA-201 Questions

Salesforce Certified Tableau Data Analyst Questions and Answers

Question 9

A Data Analyst has received a request to provide a dashboard related to employee time logs. The employees are entering their time using mobile devices throughout the day and data is stored in a cloud-based database. The end users would like to receive data on their dashboard in as close to real-time as possible.

How should the analyst best create a data source to meet these requirements?

Options:

A.

Create a connection to the database using Tableau Desktop. Publish the data source to Tableau Cloud using a live connection and disable any firewalls on the database.

B.

Create a connection to the database to retrieve the data using Tableau Bridge. Schedule the refresh of the data extract to 15 minutes.

C.

Create a connection to the database using Tableau Desktop. Publish the data source to Tableau Cloud using a live connection, ensuring the database firewall has been configured to allow connections from Tableau Cloud.

D.

Create a connection to the database using Tableau Desktop and retrieve an extract of the data. Publish the data source from Tableau Desktop to Tableau Cloud and schedule the refresh of the extract.

Question 10

A Data Analyst has two tables named EmployeeInfo and DepartmentInfo. EmployeeInfo contains four fields named Full Name, Department ID, Start Date, and Salary. DepartmentInfo contains four fields named Department Name, Size, Department ID, and VP. The analyst wants to combine the tables to meet the following requirements:

    EmployeeInfo is the first table that is dragged to the canvas,

    The records must contain the Full Name, and the Department Name, Size, and VP fields if available,

    Not all records have an exact match.

Which type of join should the analyst use?

Options:

A.

Inner

B.

Union

C.

Full outer

D.

Left

Question 11

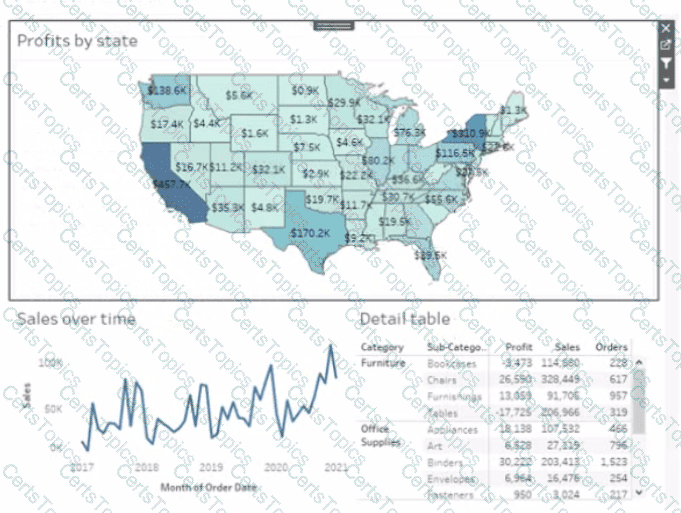
You have the following dashboard.

Currently the map is used as a filter that affects the data on the otter sheets of the dashboard

You need to configure the dashboard to ensure that selecting a data point on the map only tillers the Detail table

What should you do?

Options:

A.

From the context menu of Sales over time select Ignore Actions

B.

From the context menu of Sales over lime select Remove Dashboard Item

C.

From the context menu of Profits by Stale deselect Use as Filter

D.

From the context menu of Sales over time select Deselect

Question 12

A Data Analyst has the following chart that shows the sum of sales made in different cities.
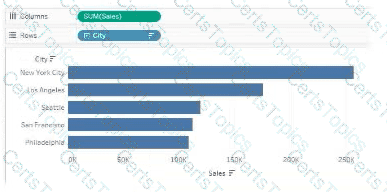
The analyst wants to show the average sale amount for a city when users hover their mouse over any of the bars.

What should the analyst do?

Options:

A.

Right-click on SUM(Sales) in the Columns and select Include in Tooltip.

B.

Drag Sales to Tooltip on the Marks card and change Aggregation to Average.

C.

Drag Sales to Tooltip on the Marks card and modify the Tooltip text.

D.

Right-click on SUM(Sales) in the Columns and change Aggregation to Average.