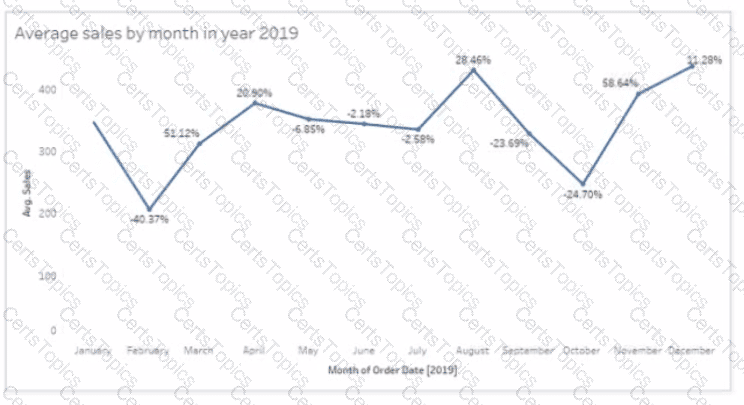
You have the following line chart that shows the average sales by month.

Which month had the biggest increase in swage sales compared to me previous month in 2019?
You plan to create a visualization that has a dual axis chart. The dual axis chart will contain a shape chart and a line chart will use the same measure named Population on the axis.
You need to configure be shapes to be much larger than the line.
What should you do?
You have the following visualization.
The Last() calculation is set to compute using Table (across)
Which value will appear in the crosstab for the Consumer segment of the year 2018 if you change compute to use Oder Dale?
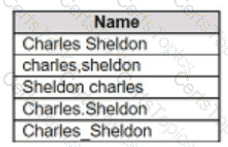
You have the following dataset:

Which grouping option should you use in Tableau Prep to group all five names automatically?