You have the following line chart that shows the average sales by month.
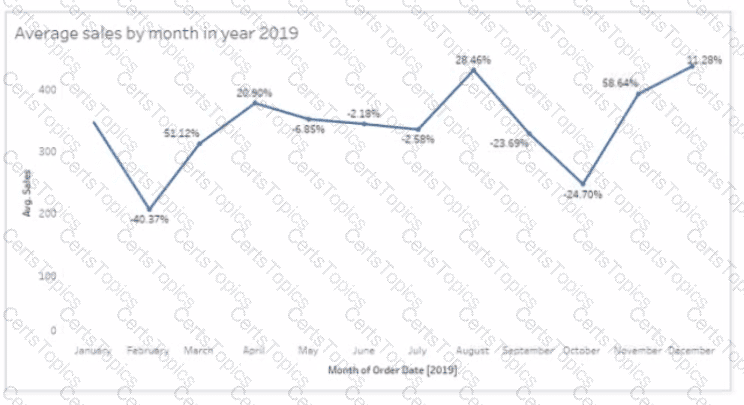
Which month had the biggest increase in swage sales compared to me previous month in 2019?
You have the following box plot that shows the distribution of average profits made in every state by region.
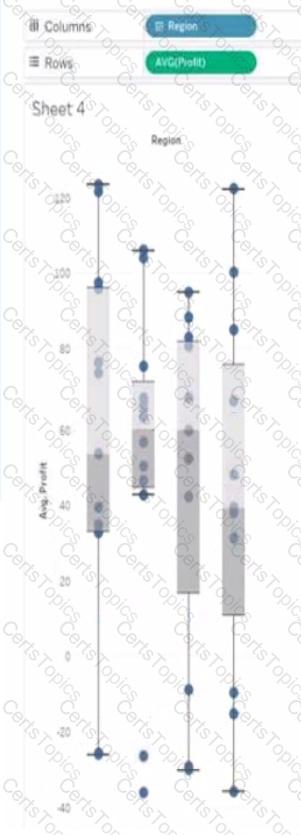
Which region has the smallest distribution of profits?
You have the following tiled dashboard that has one sheet.
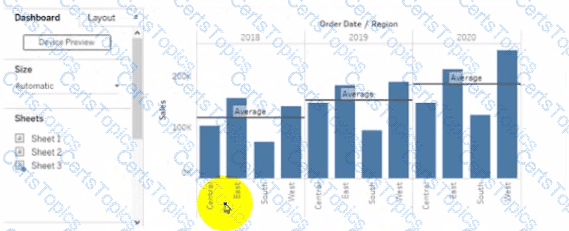
You want to replace the sheet with Sheet2.
What should you do?
You have the following dashboard.
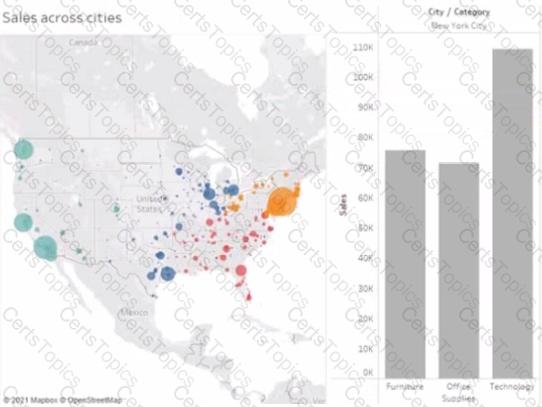
When a user selects a only on the map the data on the bar chart must show only the data for the selected city. The data in the bar chart must change only when the user selects a different city How should you configure the dashboard action? (Use the dropdowns in the Answers Area to select the correct options.)

Copyright © 2021-2026 CertsTopics. All Rights Reserved