Which chart type is appropriate for viewing the association between two scale variables?
Suppose you want to copy and paste variable definitions from 481 variables in one data file to 481 corresponding variables in a second data file.
The only way to do this is to select and copy each variable’s definitions in the first file and paste to the corresponding variable in the second file.
In order to import data from database sources such as Access and Oracle into IBM SPSS Statistics, you must first export the data from the database to a tad file and then import this tad file into IBM SPSS Statistics?
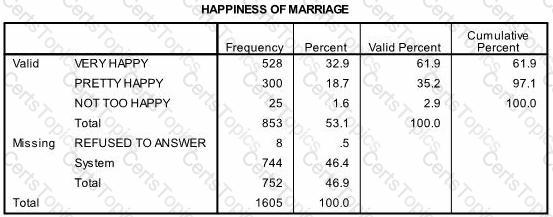
Suppose you want to get help on the Cumulative Percent column in a FREQUENCIES table. Using the figure below, how would you do it?
Copyright © 2021-2025 CertsTopics. All Rights Reserved
