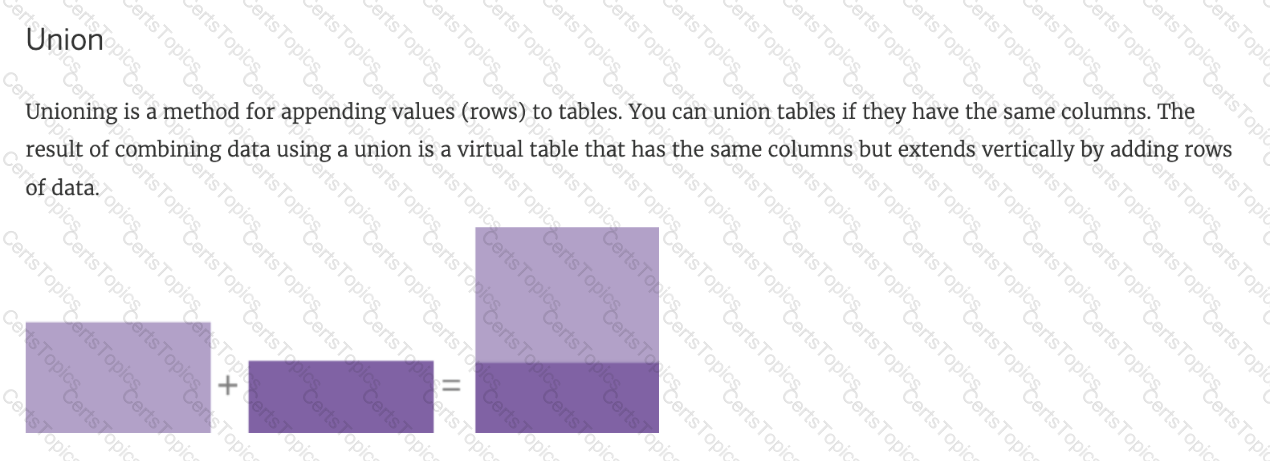
You can _______________ your data to combine two or more tables by appending values (rows) from one table to another
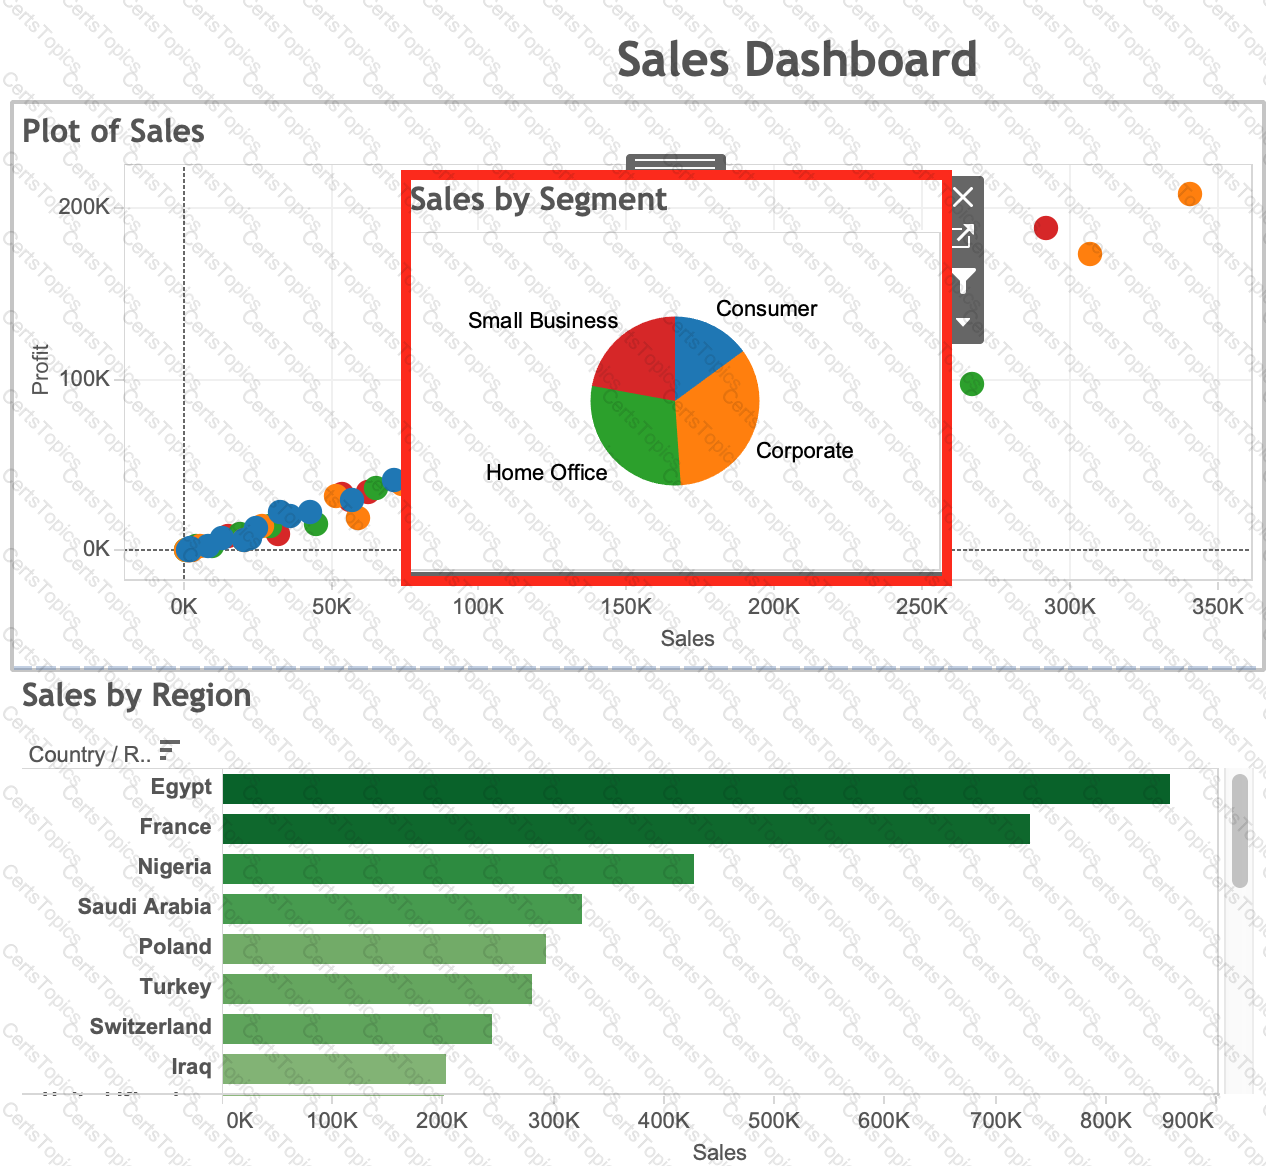
Which of the following are true about Dashboards in Tableau?
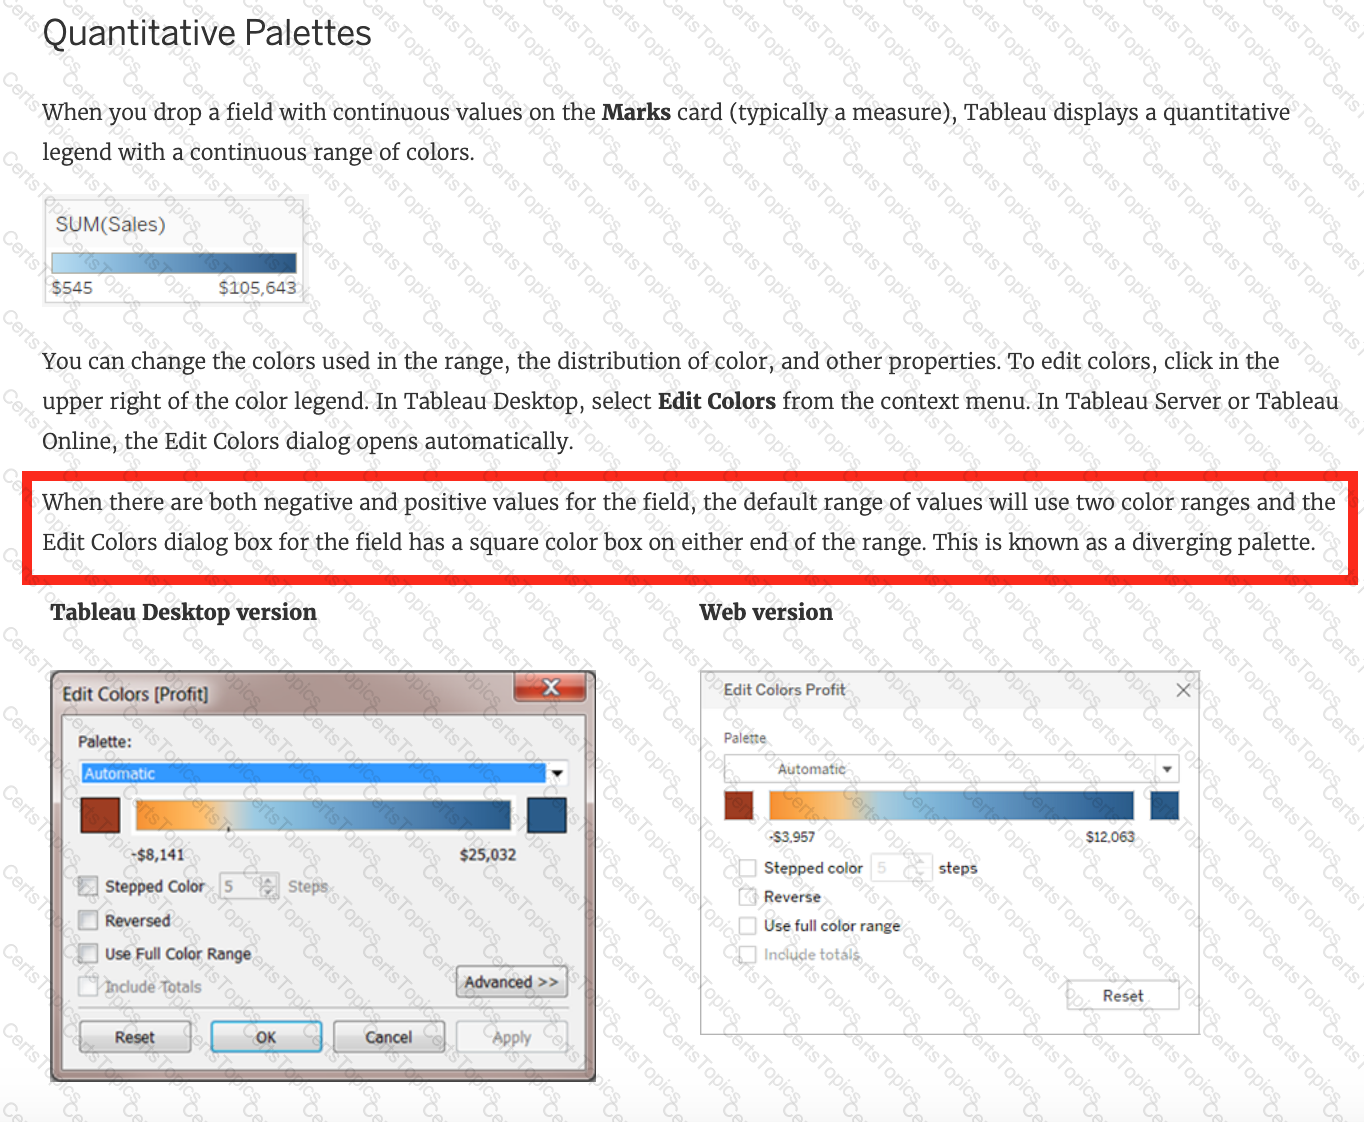
When there are both negative and positive values for a field, the default range of values will use two color ranges. This is known as a ______________ palette.
What are two use cases for creating hierarchies from the Data pane? Choose two.
Which of the following are correct ways to define a join in Tableau version 2020.3 and above?
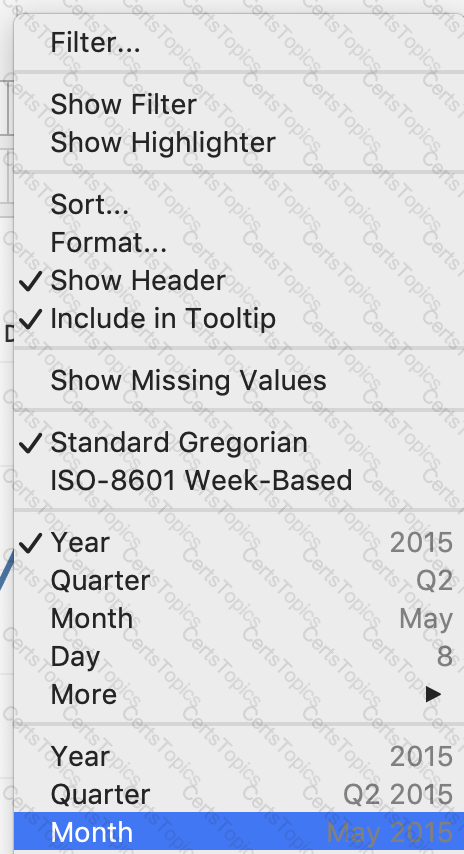
When creating a date filter in Tableau, to what does Anchor refer?
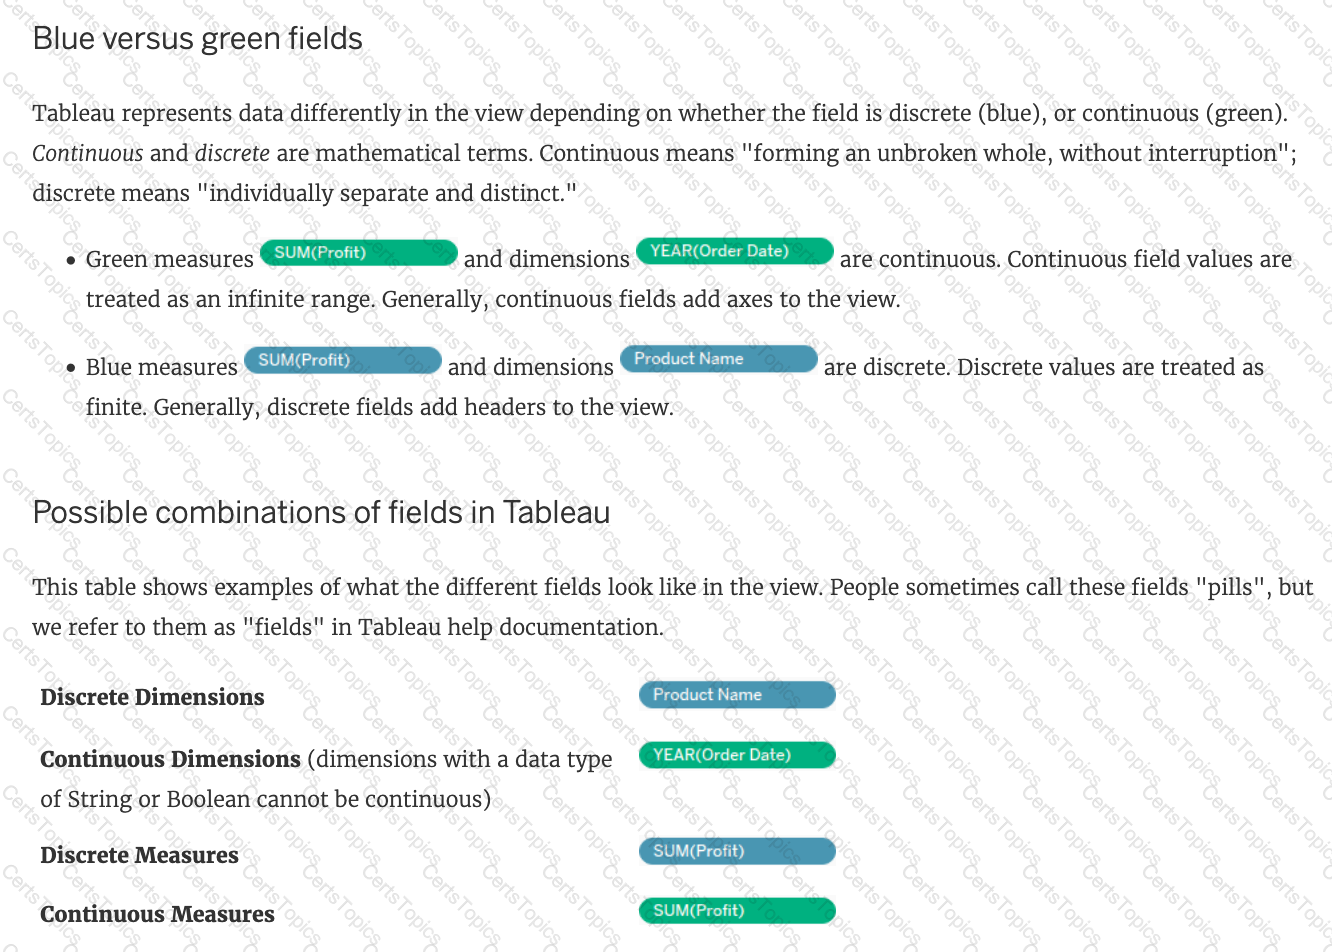
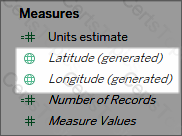
What do the colours Blue and Green represent in Tableau?
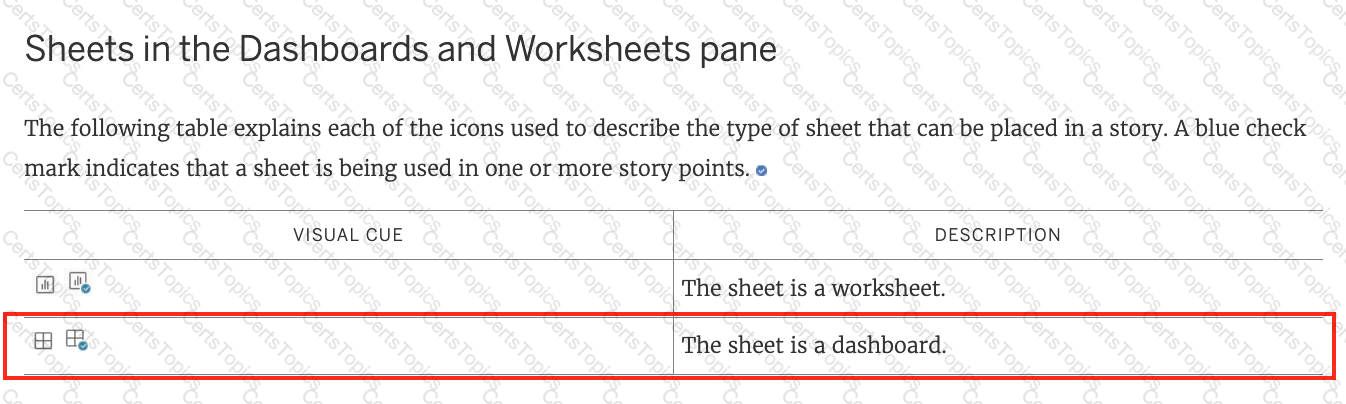
True or False: A sheet cannot be used within a story directly. Either sheets should be used within a dashboard, or a dashboard should be used within a story.
You need to create a calculation that returns a customer name followed by a comma, a space, and then the customer's age (for example: John Doe, 32).
What should you include in the calculation?
What are two correct methods to change the data type of a field? Choose two.
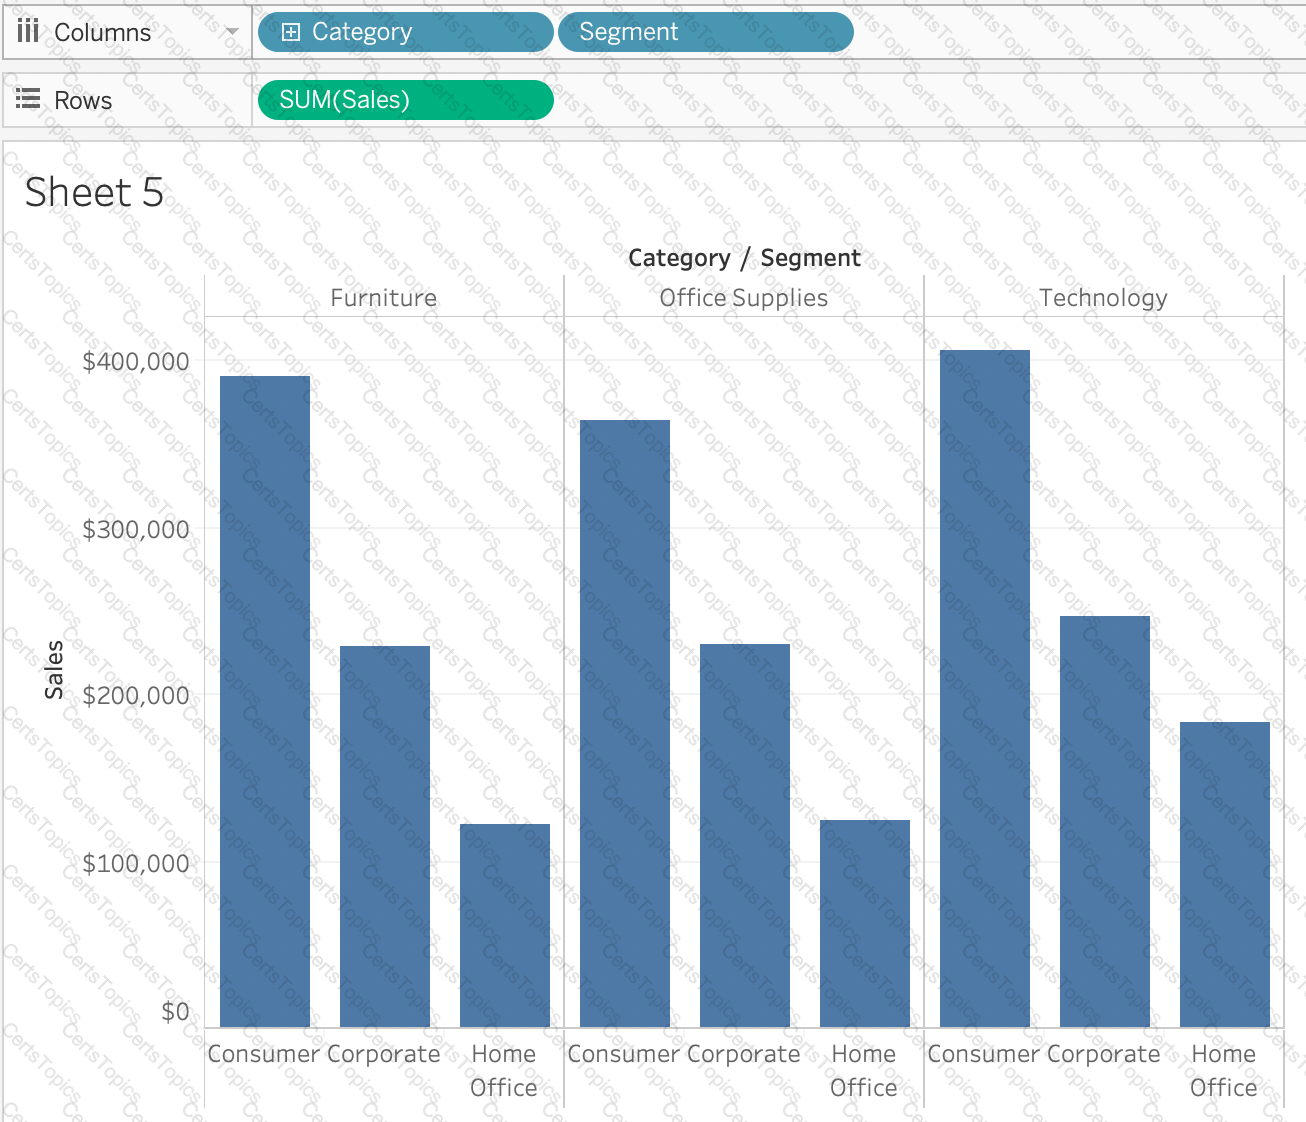
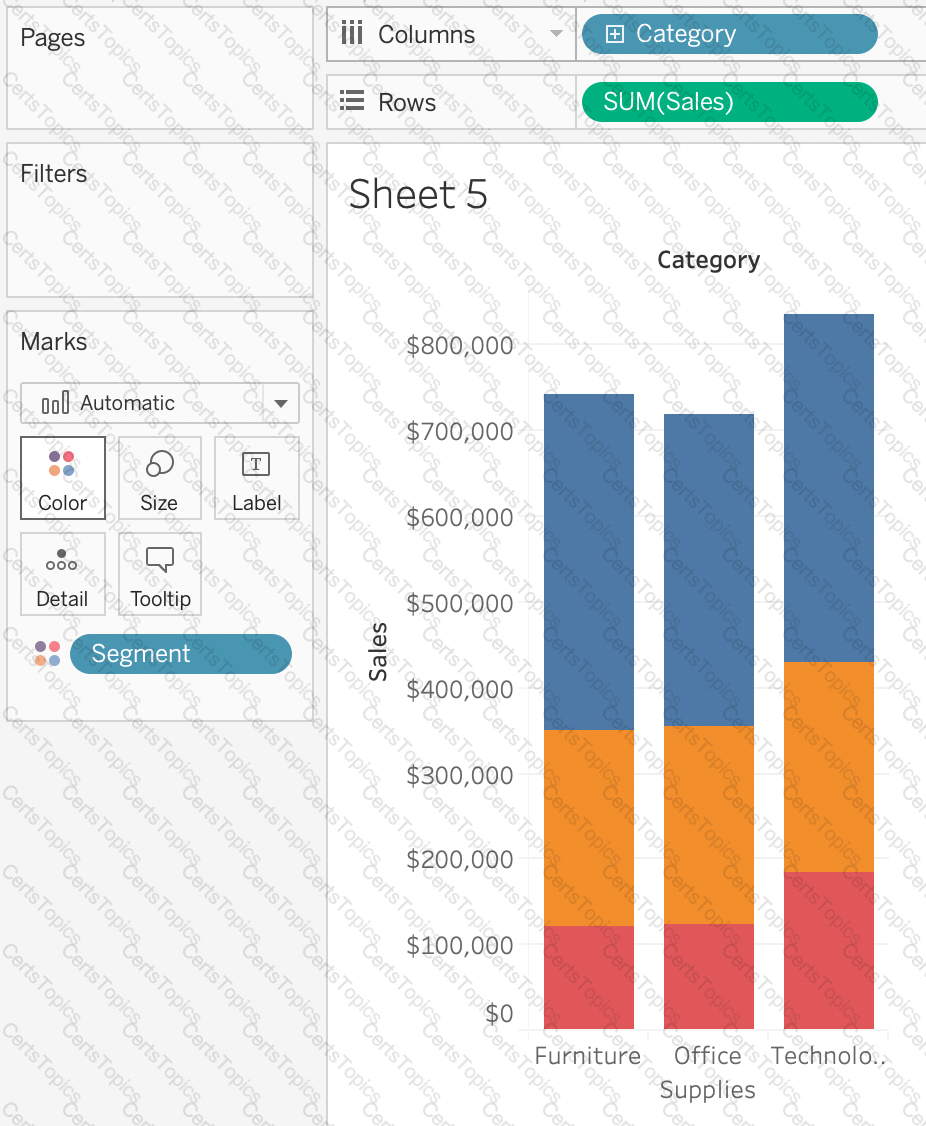
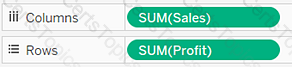
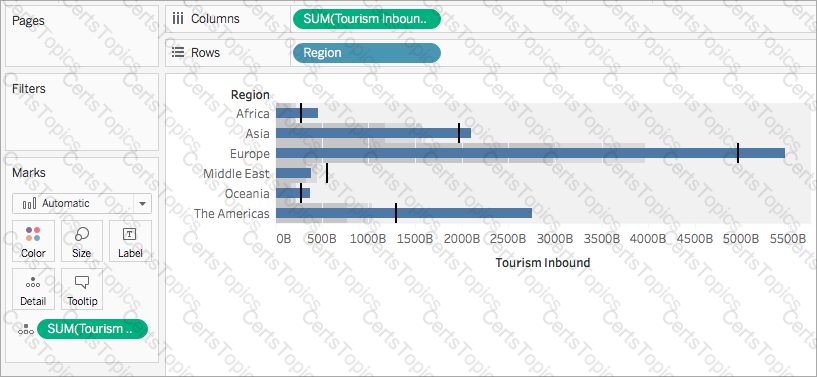
You have a bar chart that has a dimension on the Columns shelf and a measure on the Rows shelf.
How can you make a stacked bar chart?
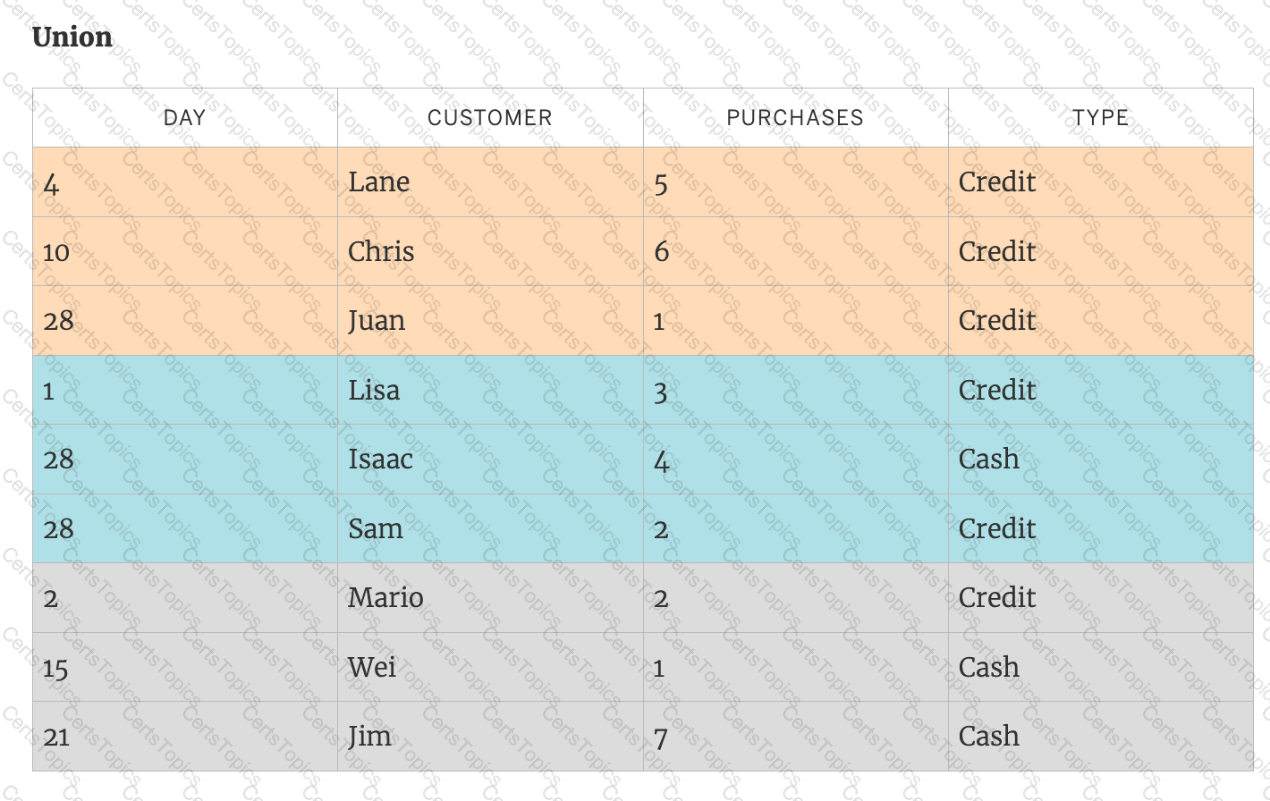
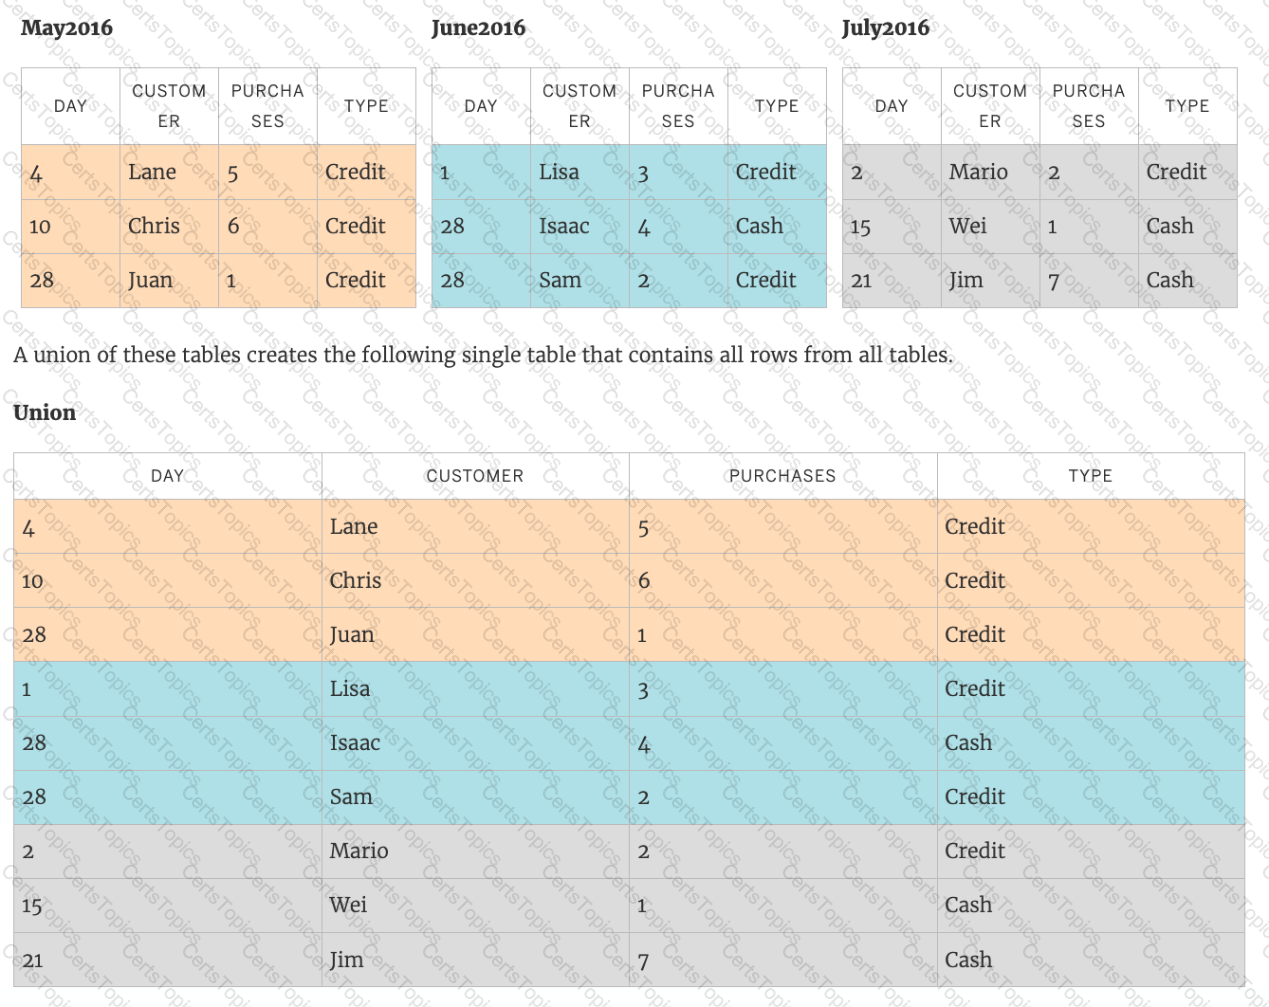
______________ is a method for appending values (rows) to tables. You can use this method if both tables have the same columns. The result is a virtual table that has the same columns but extends vertically by adding rows of data.
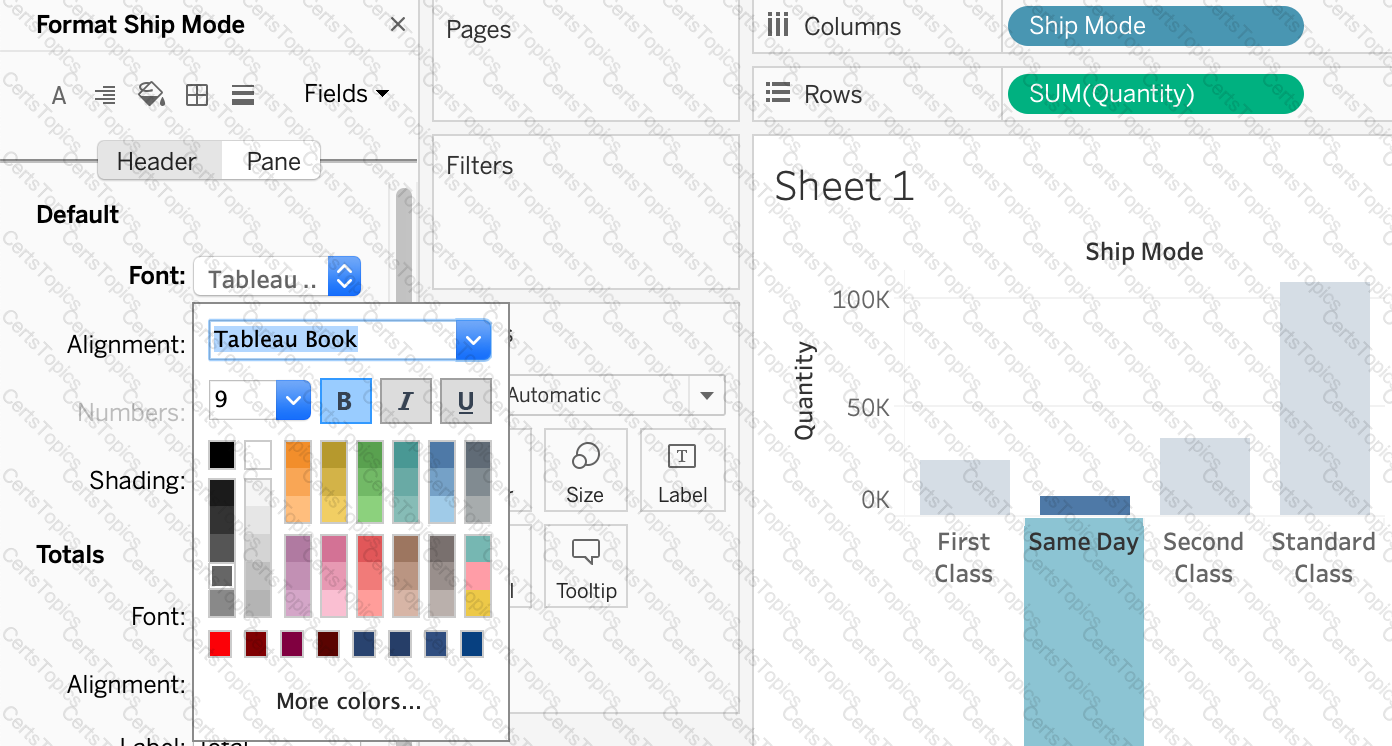
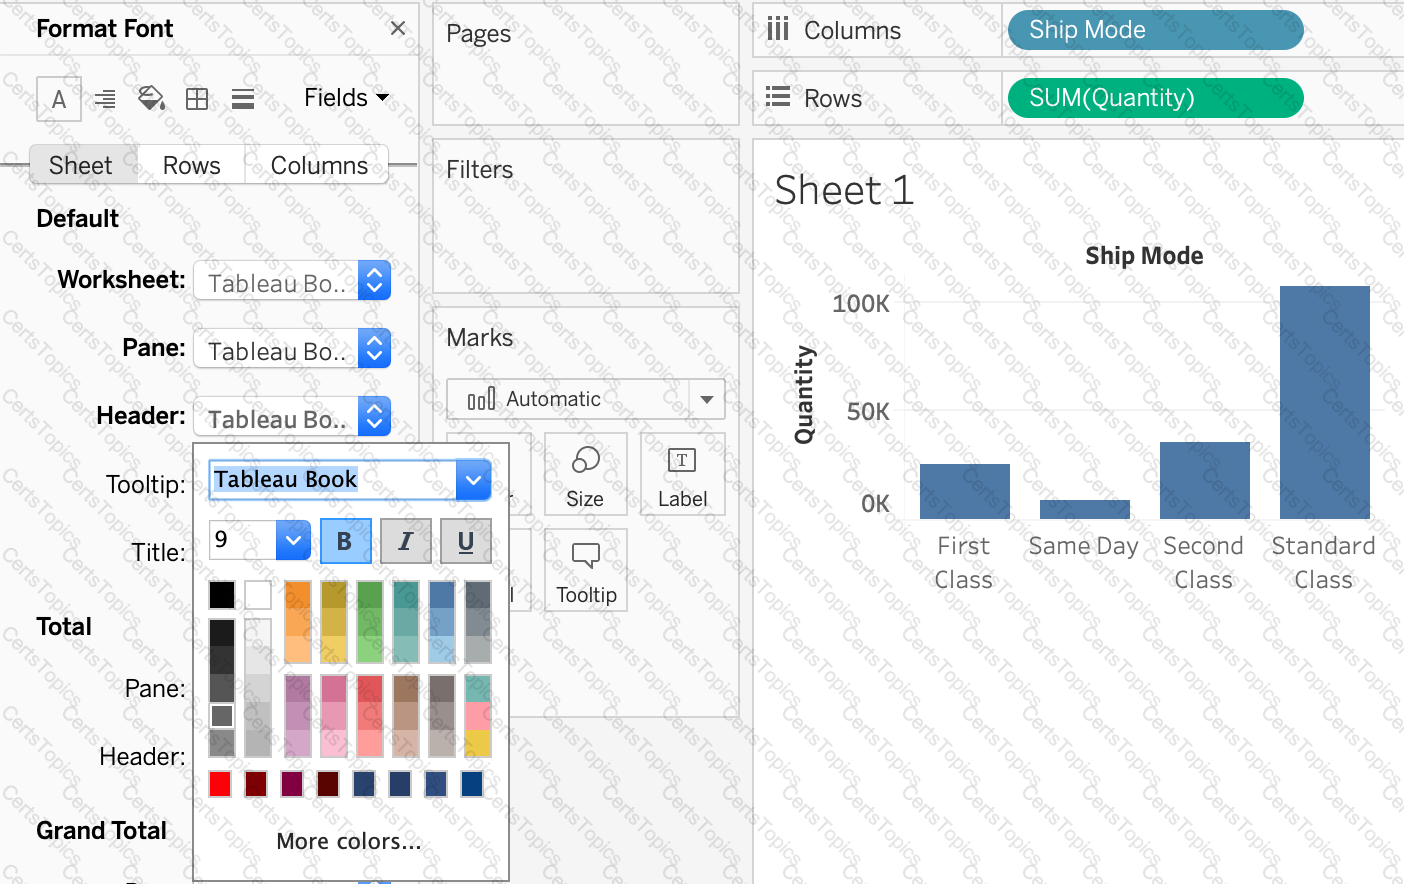
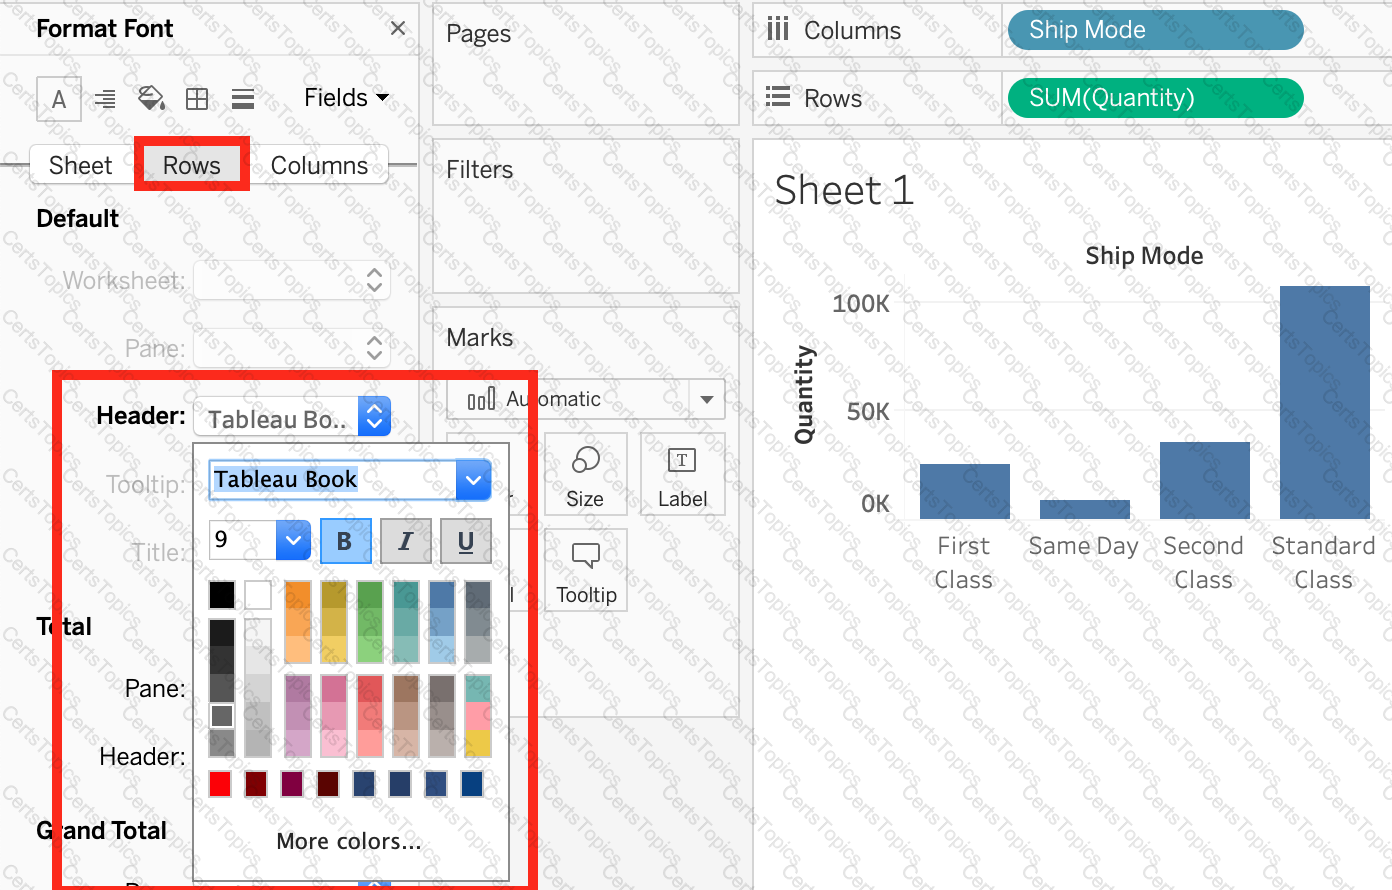
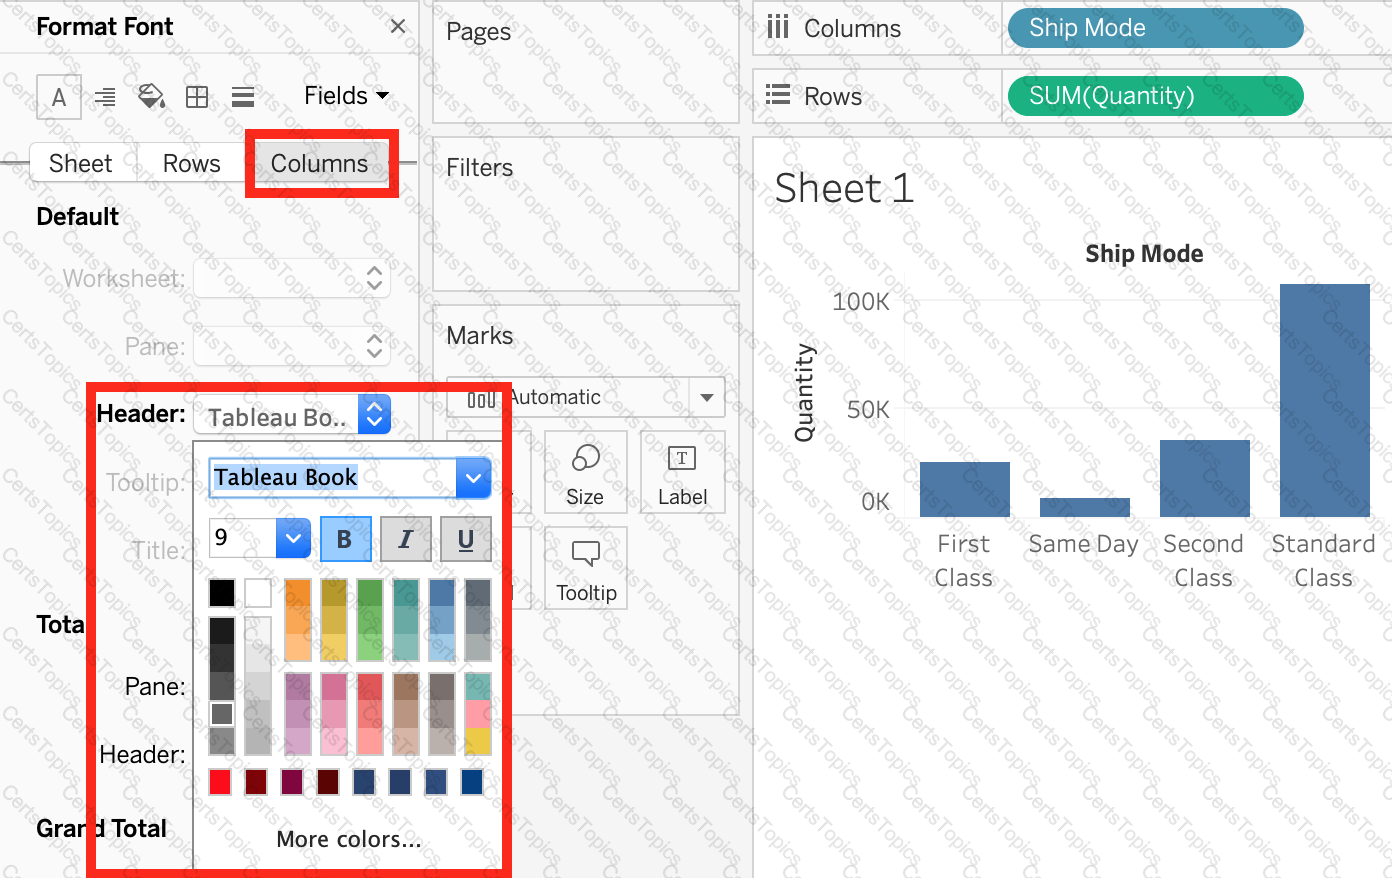
Which of the following are valid way(s) to make either of Rows or Columns Bold without affecting the other?
Which two filter modes can you use with dimension filters? Choose two
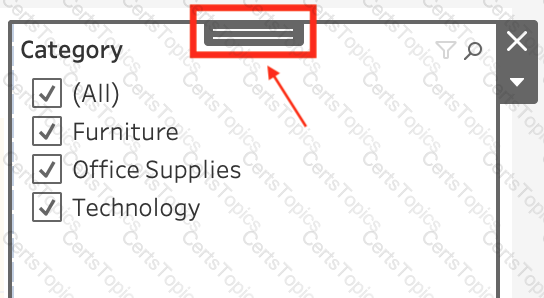
If you have a dashboard and are displaying its filter, how can you rearrange it?
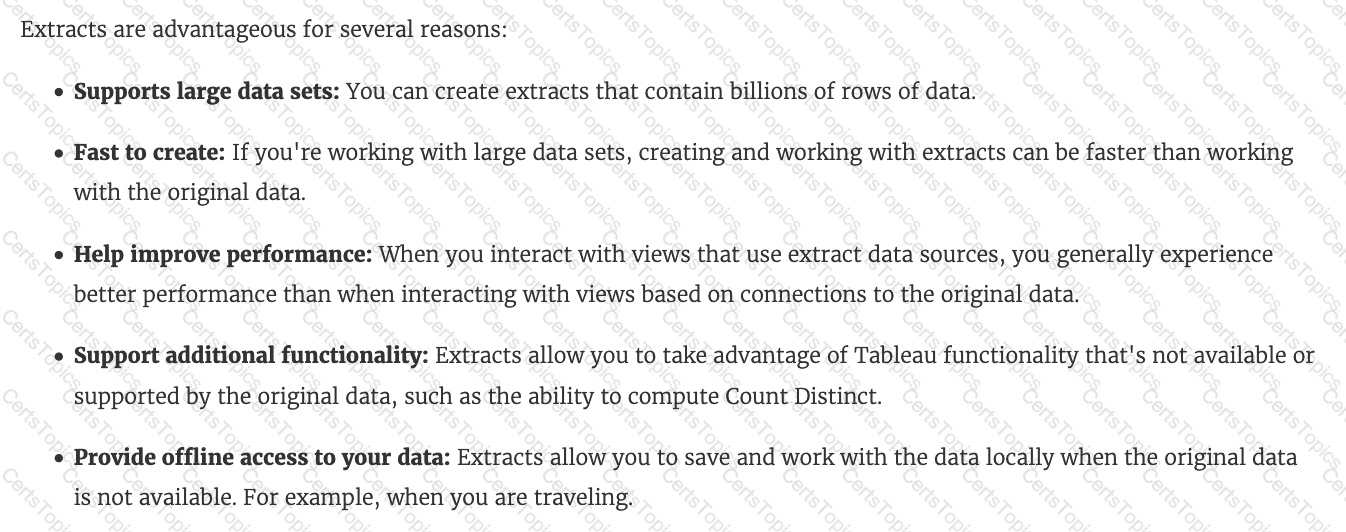
Which of the following are valid reasons to use a Tableau Data Extract (.tde) over Live Connections?
Which of the following are compelling reasons to use a Stacked Bar Chart?
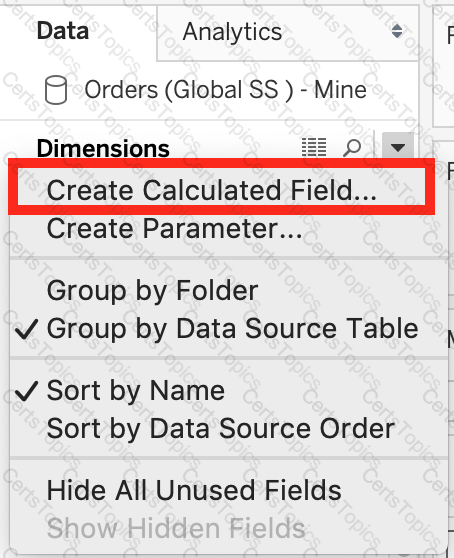
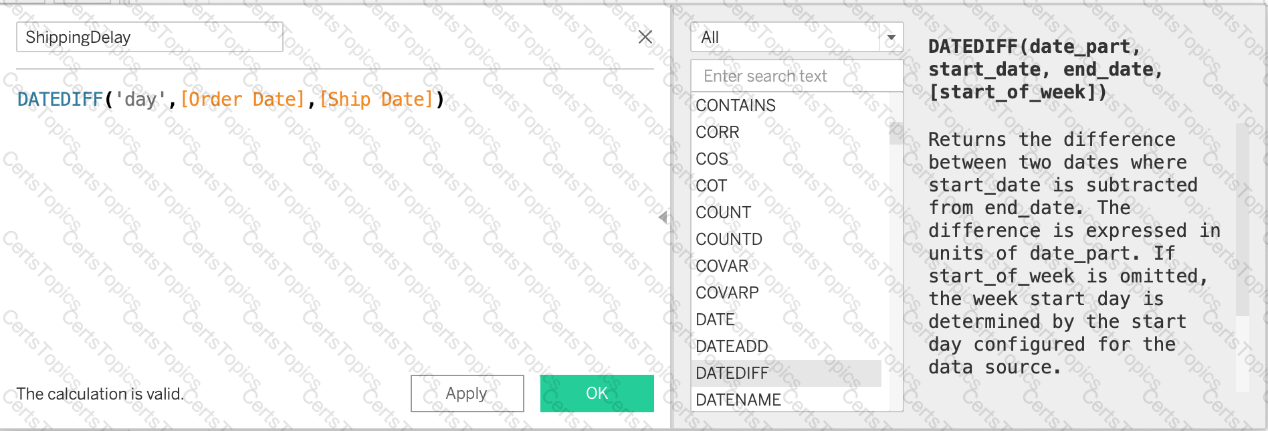
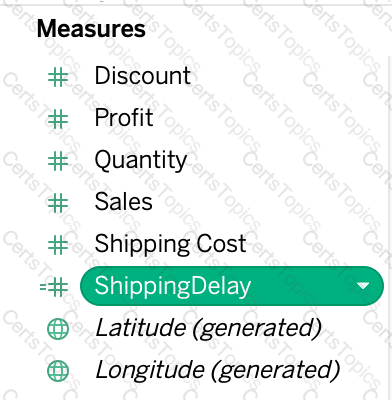
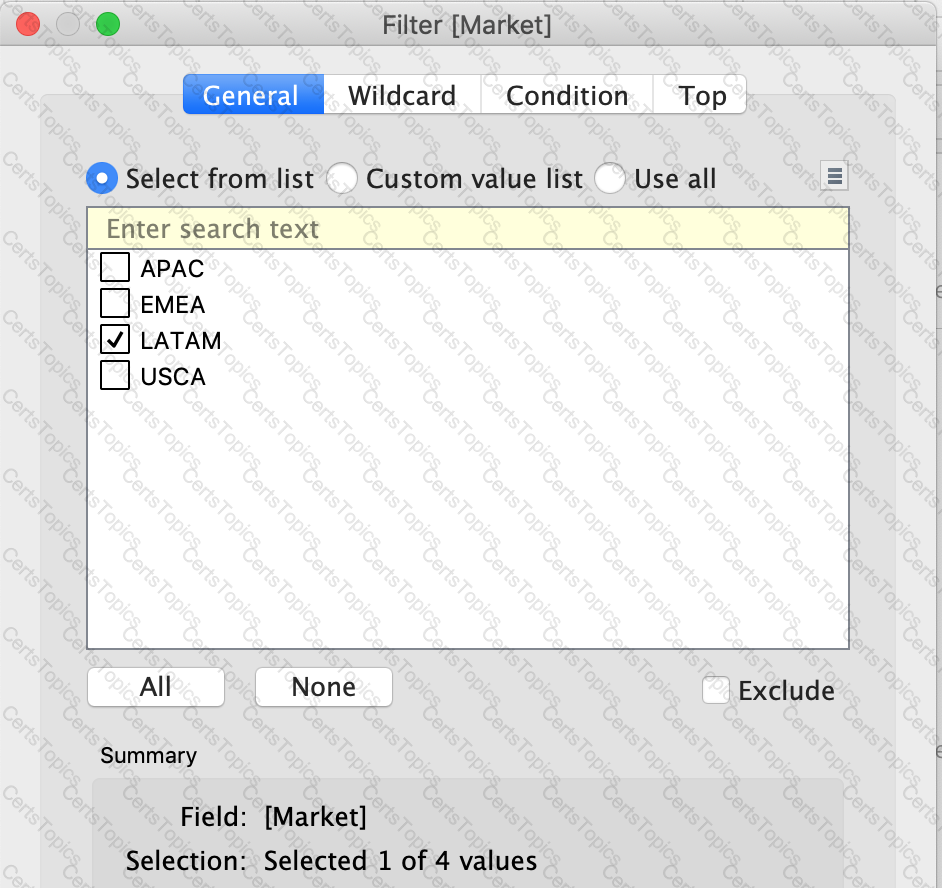
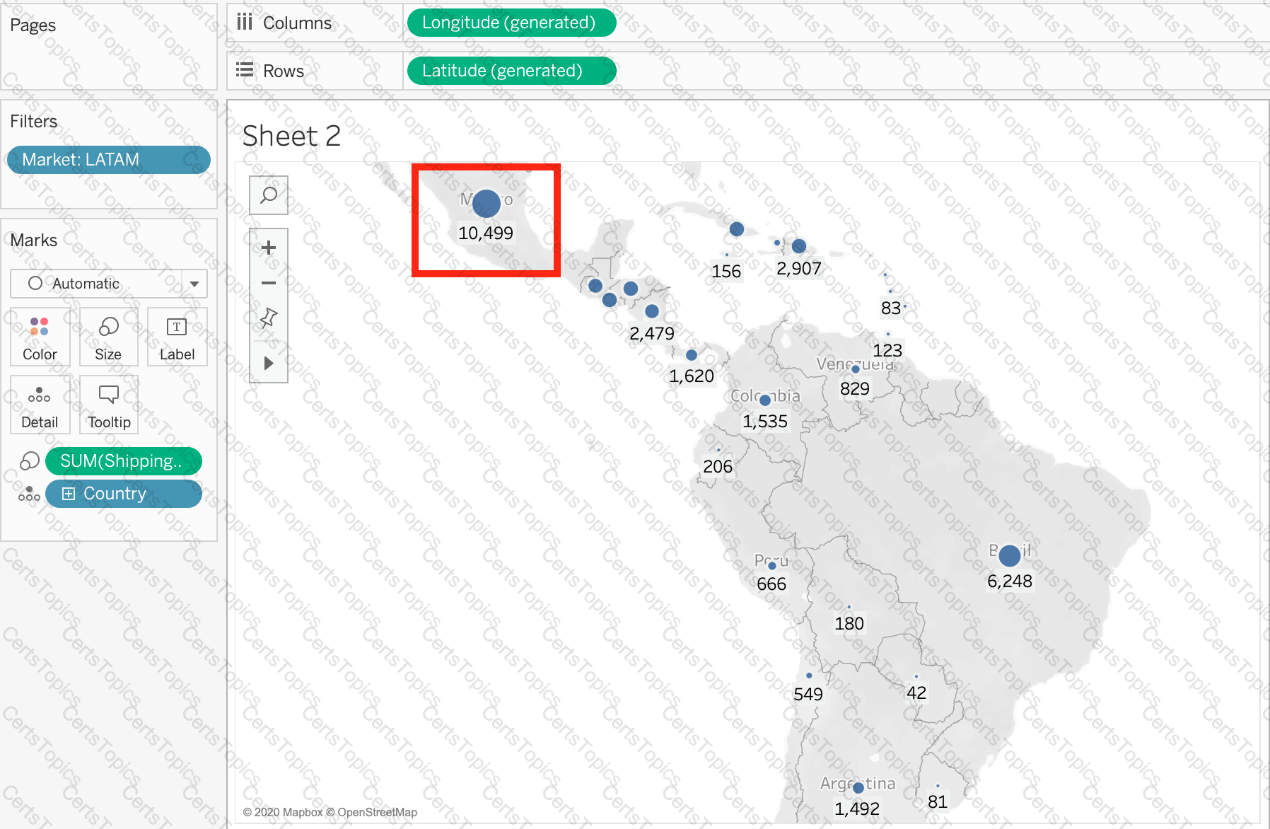
Using the dataset, plot a Map showing all the countries, filtered by Market to only include LATAM. Which country in the LATAM Market has the highest shipping delay (sum of total number of days between the order date and the ship date)?
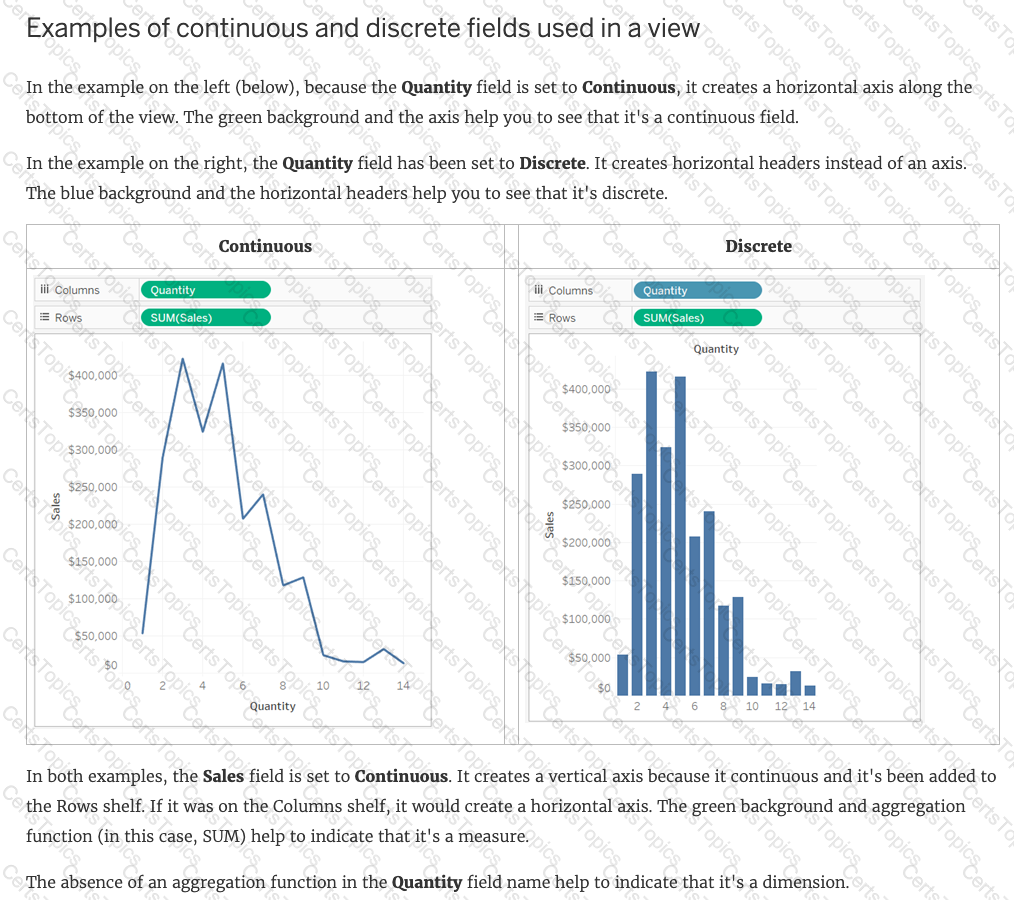
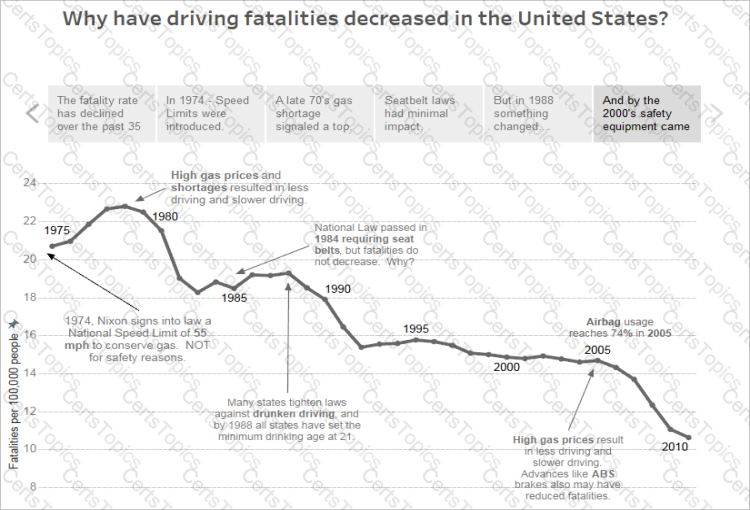
By definition, Tableau displays measures over time as a ____________
When creating an extract, what are three options for specifying how much data to extract? Choose three.
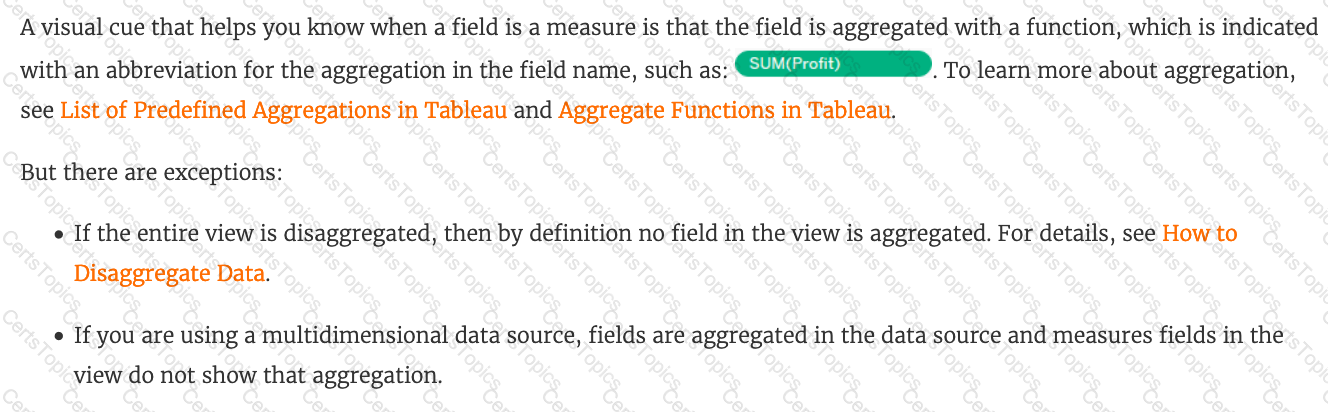
Which two types of aggregations can be applied to string fields? Choose two.
You have the following visualization.
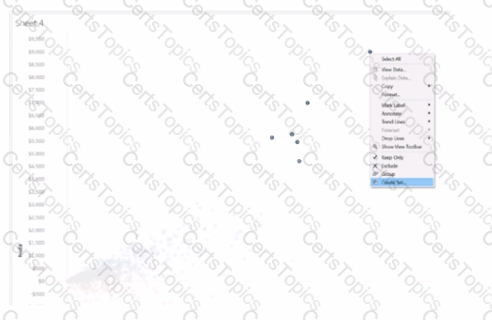
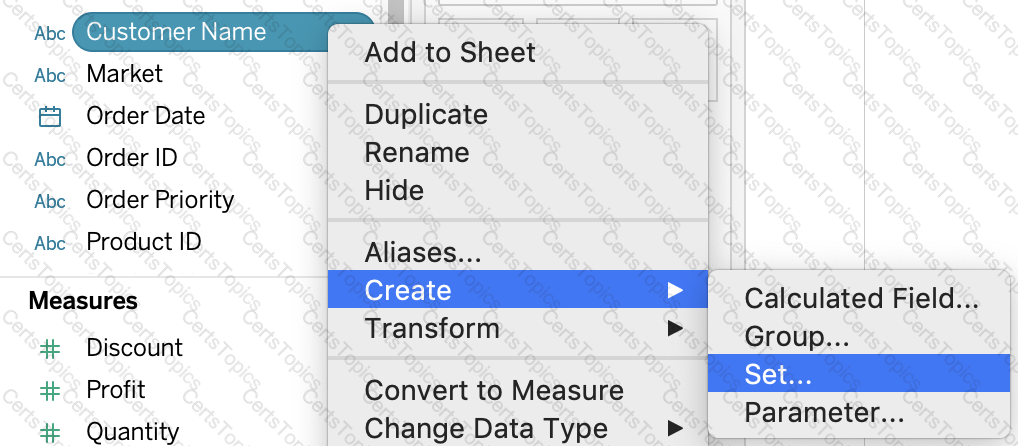
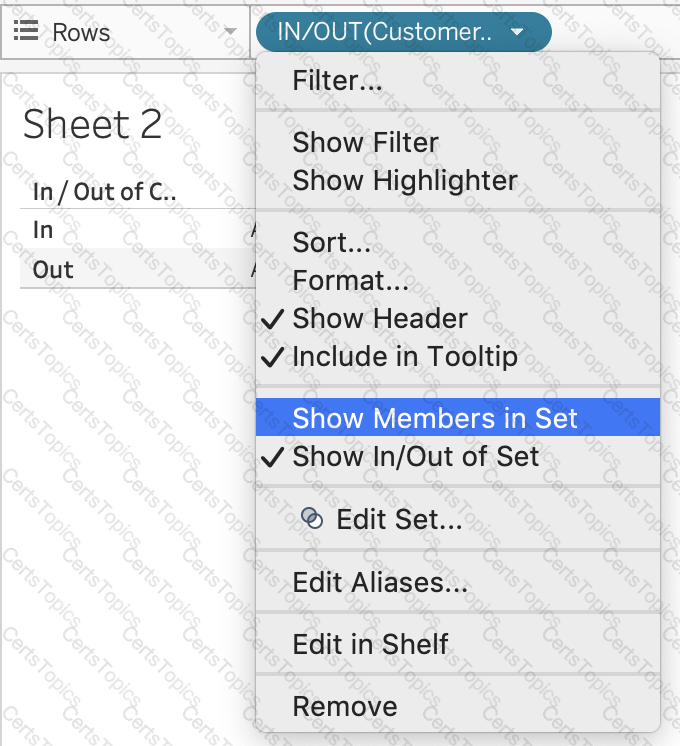
Which set type is created when you select the Create Set option?
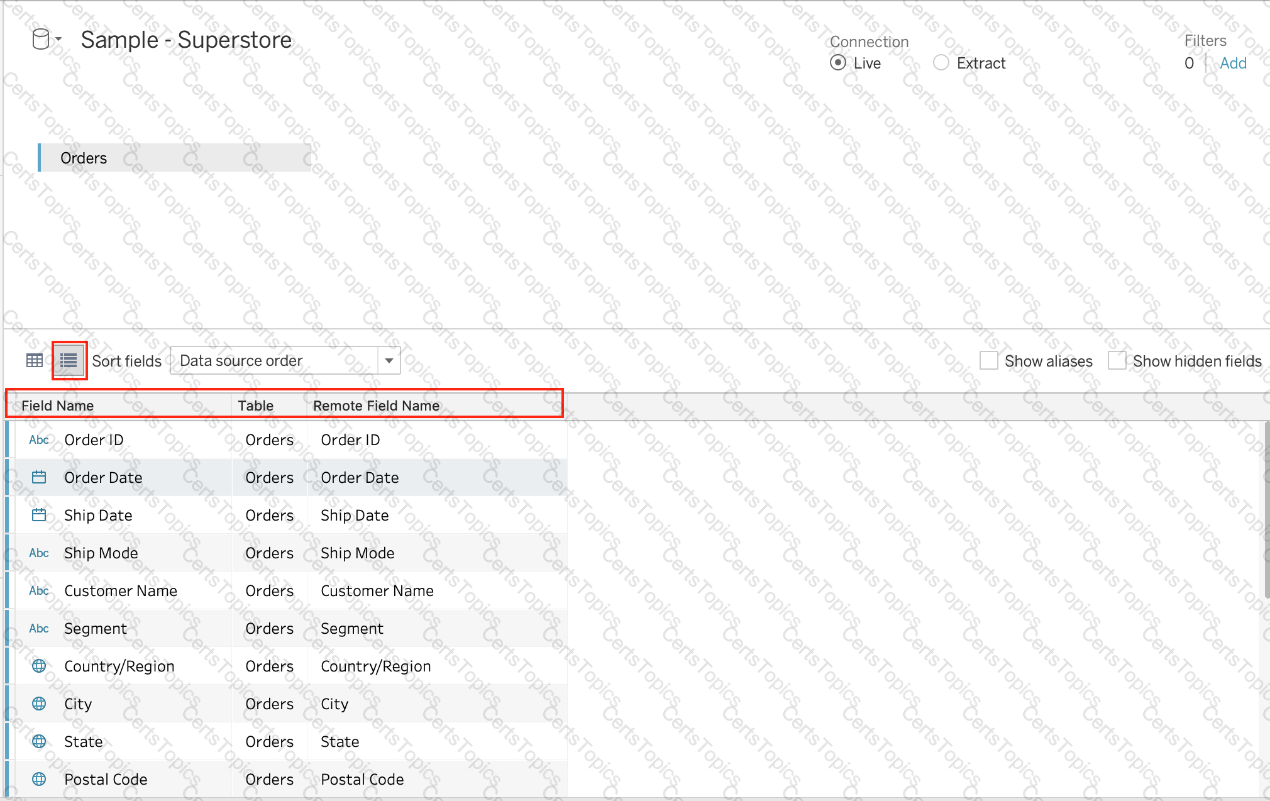
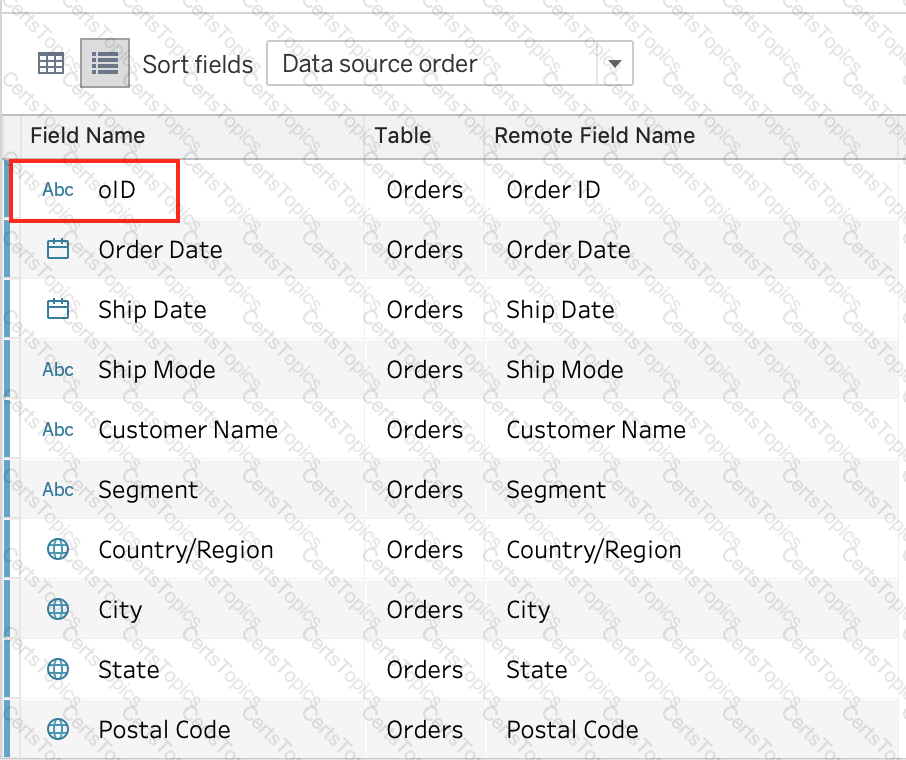
When using the manage metadata option, we can create custom names for columns where _____________ is the original name of the column whereas _____________ is the custom name we created in Tableau.
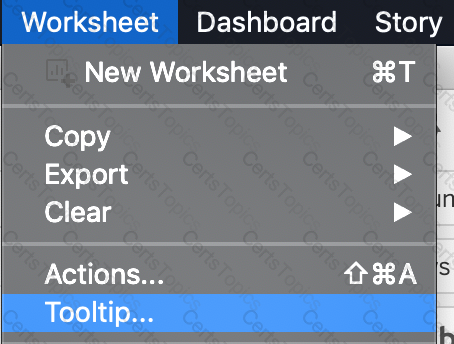
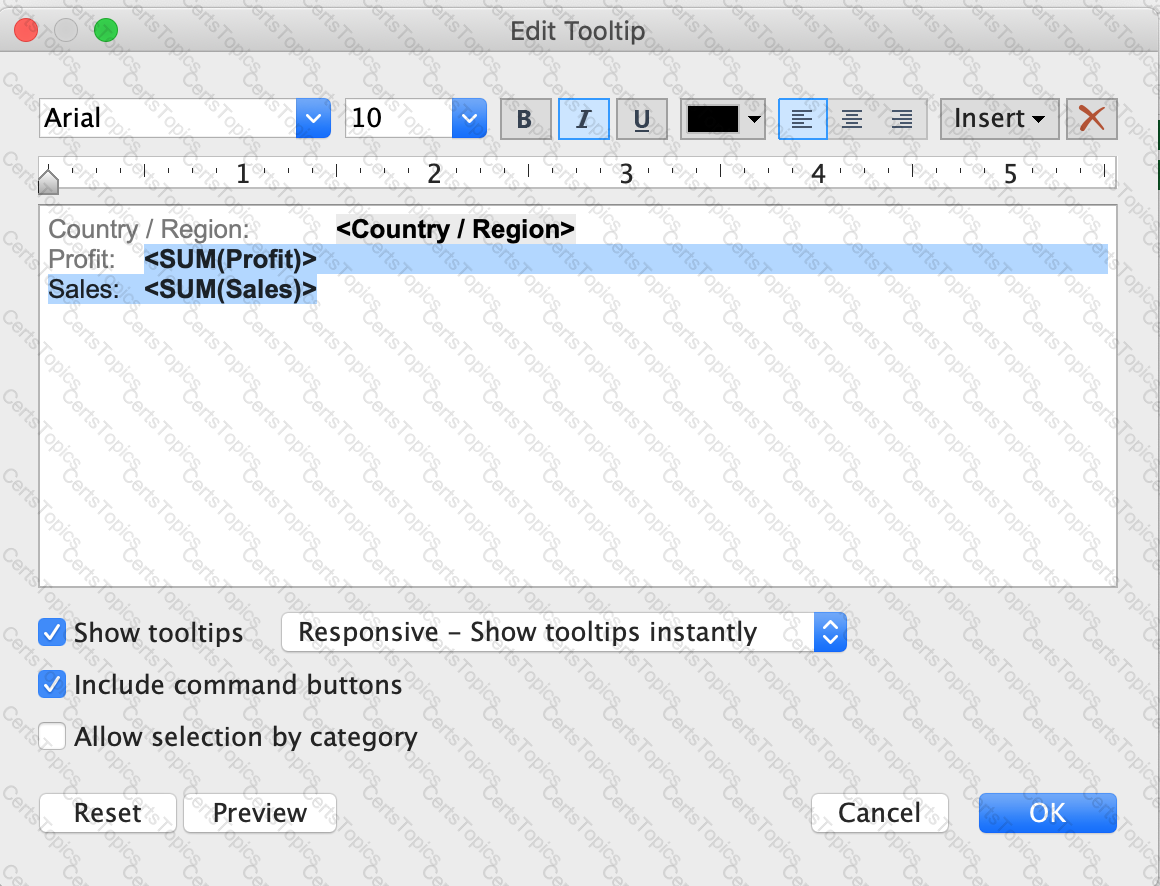
Which of the following are valid ways to italicize Tooltip content in Tableau?
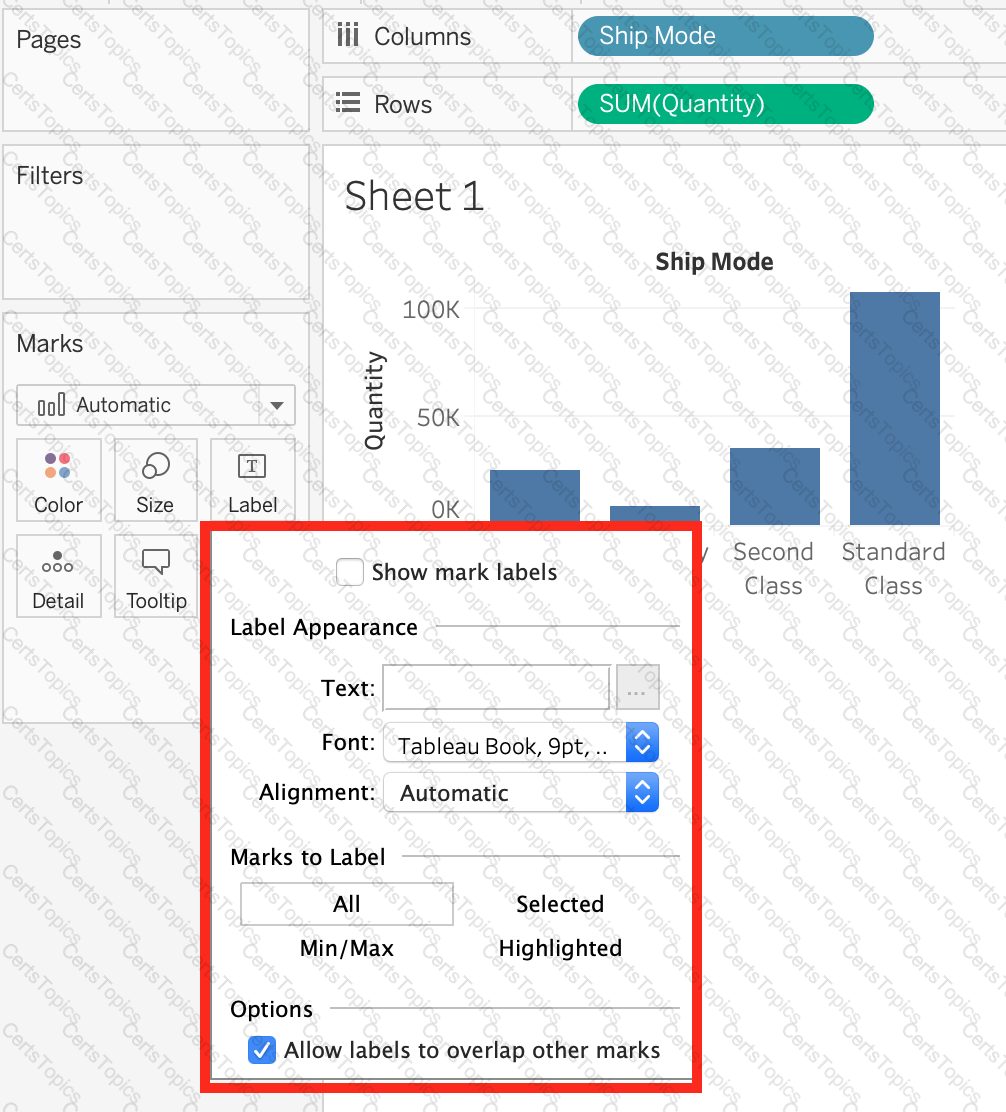
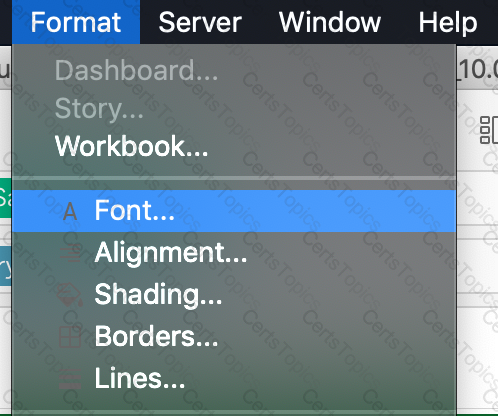
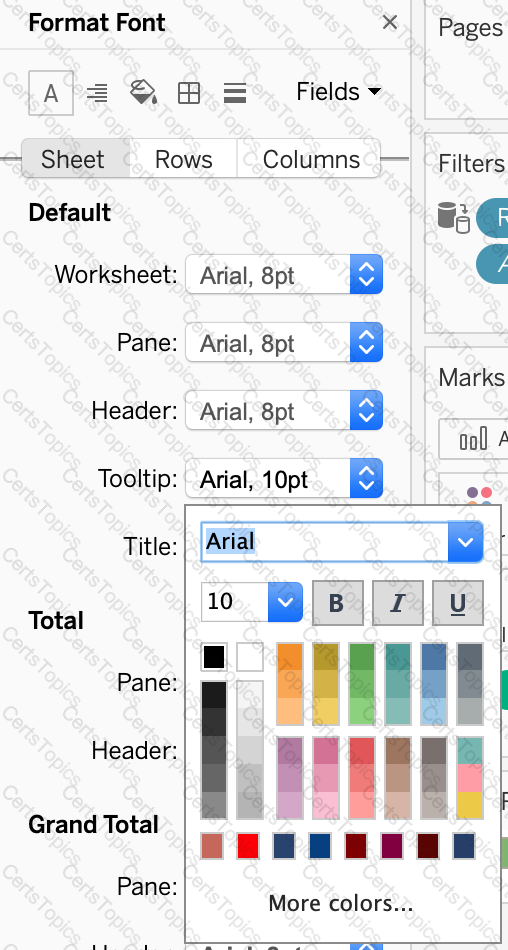
You want to update the font of an entire workbook.
What should you use to configure the default fonts?
By default, what does Tableau do when you connect to a data source?
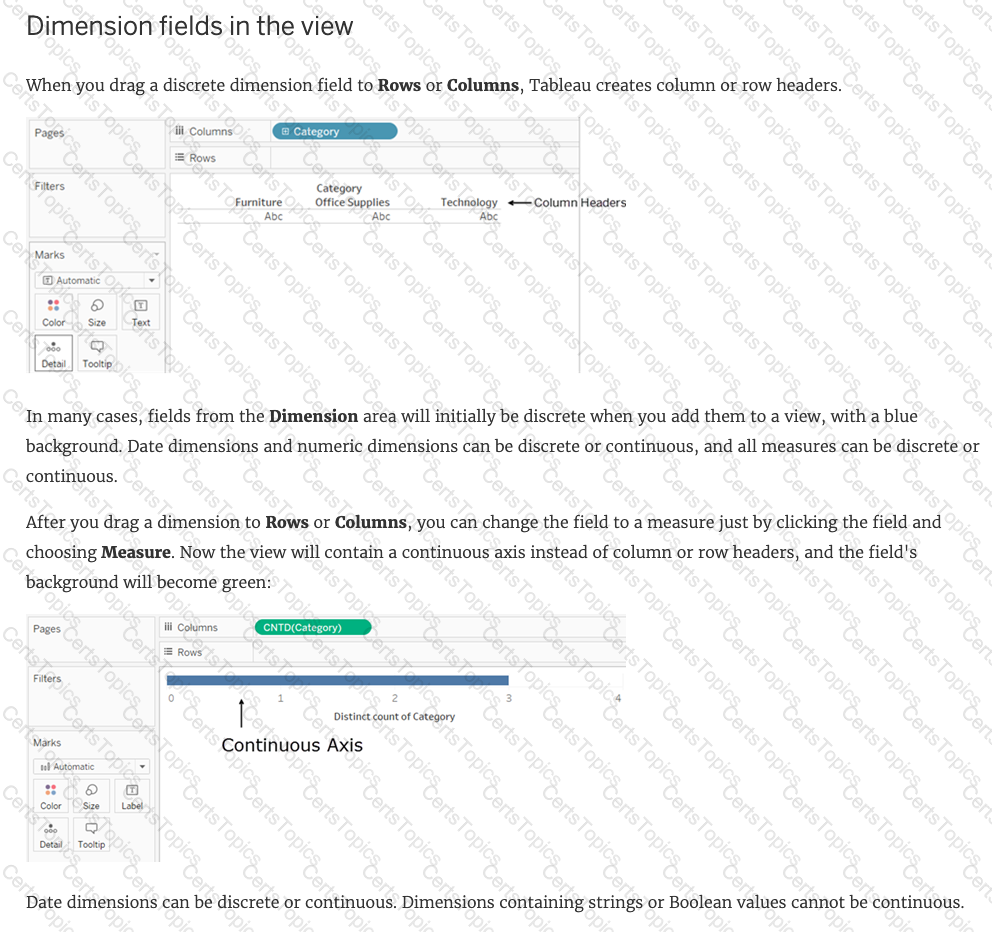
Dimensions containing ____________ and ____________ values cannot be continuous.
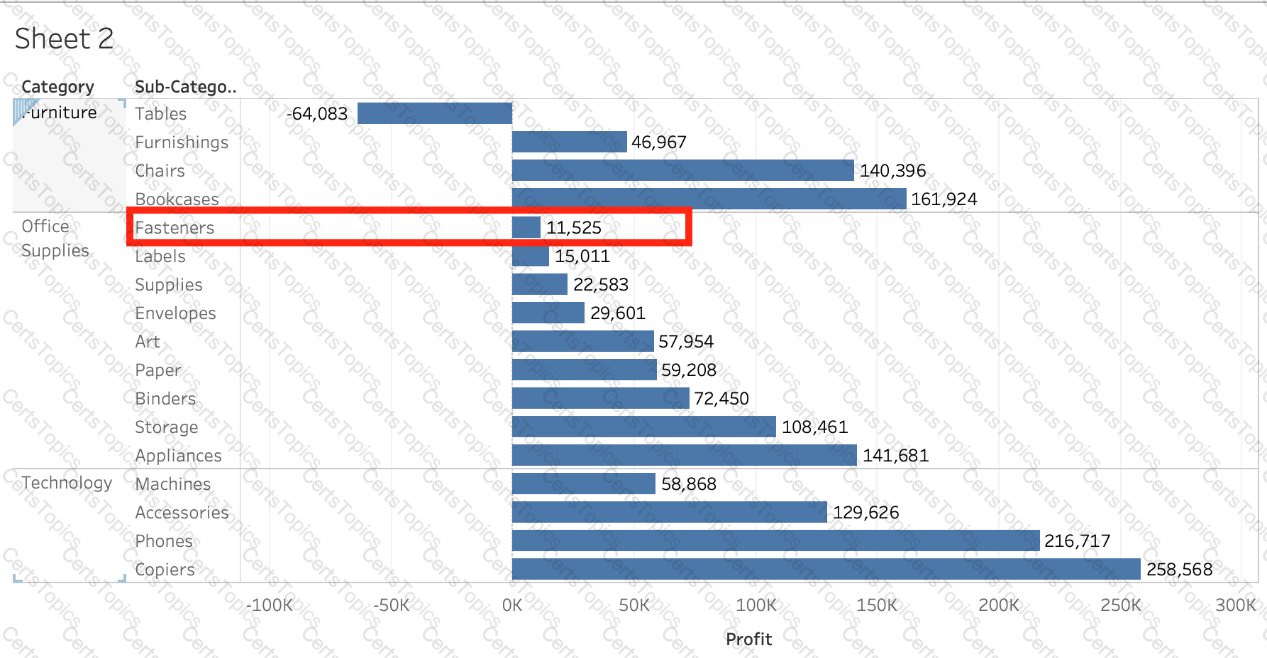
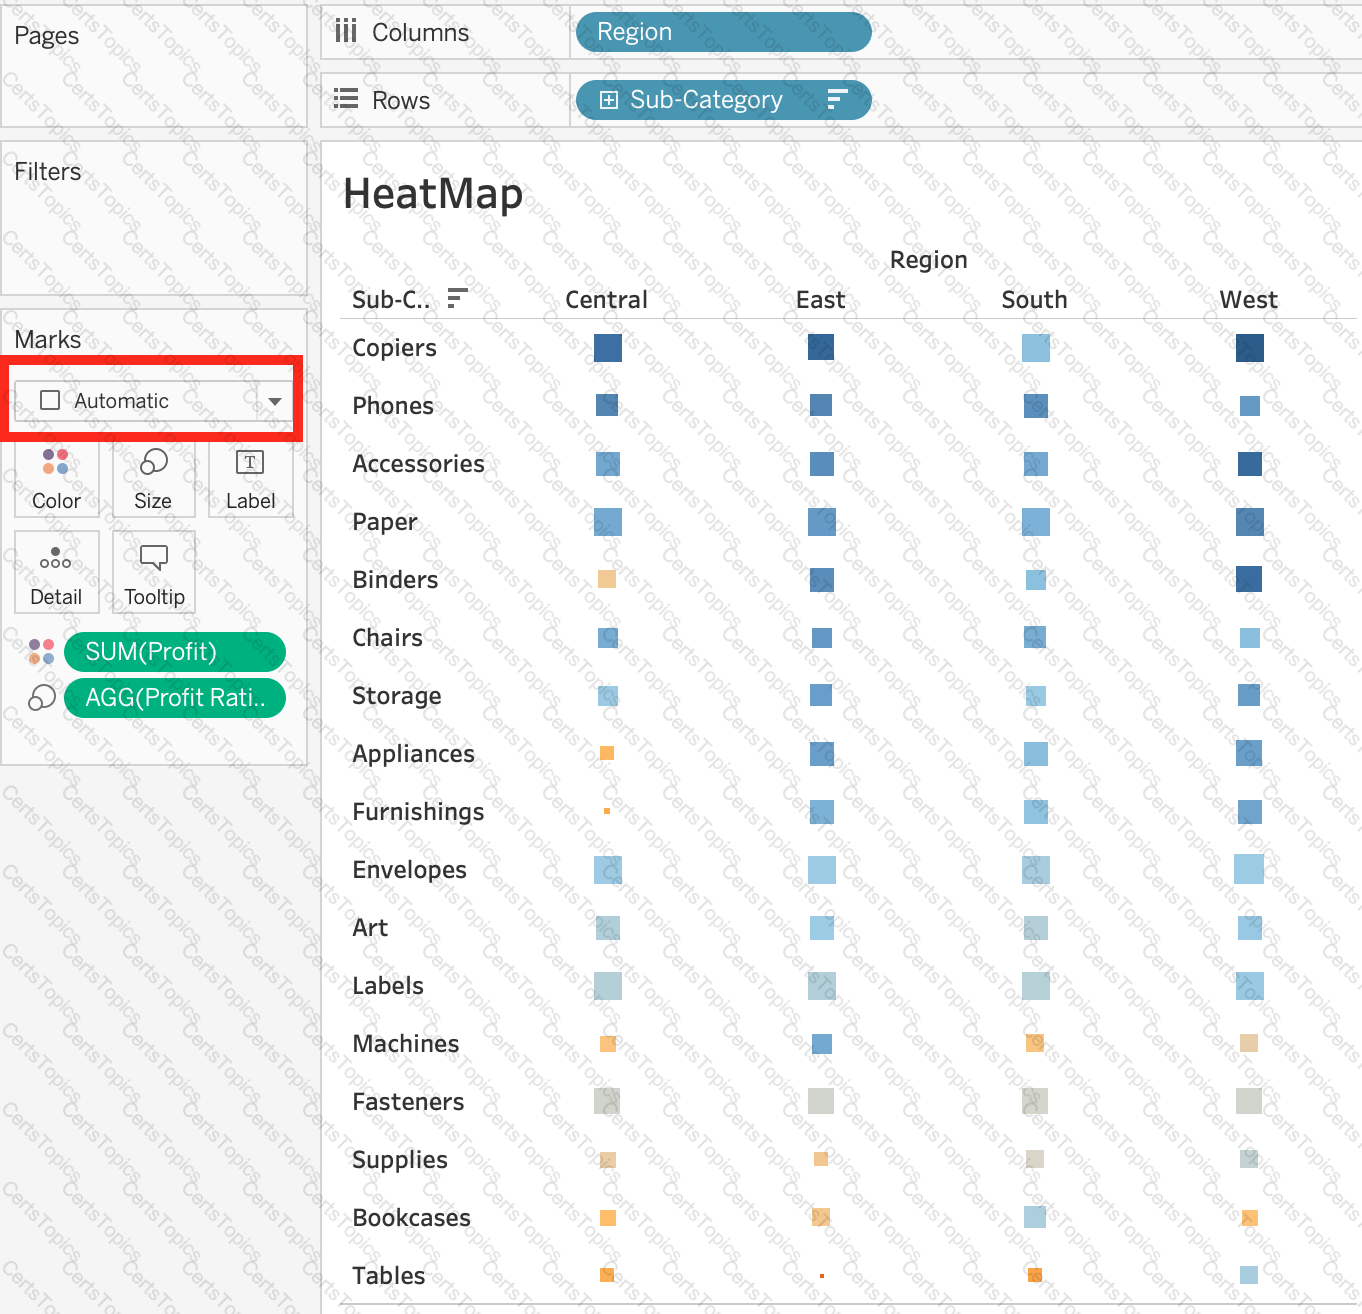
Which Sub-Category had the least Profit in the Office Supplies category?
What does it imply if a field has a blue background?
Question 45: Skipped
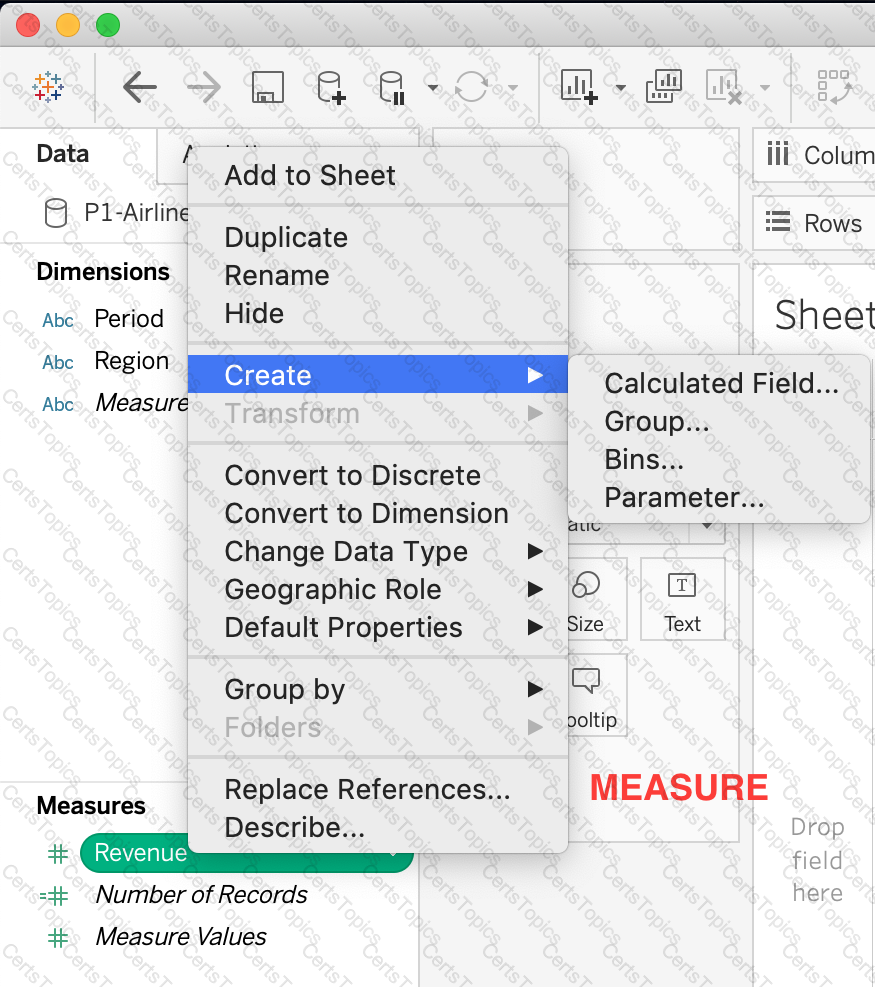
You have just created a histogram and now want to be able to change the size of bins dynamically. Using which of the following will easily satisfy your requirement?
Skipped Join the Geo Data and Time Series Table on the Item Number ID column, and display the Store count for every State on a Map. What was the Store count in 2017 for Texas (TX)?
Join the Geo Data and Time Series Table on the Item Number ID column, and display the Store count for every State on a Map. What was the Store count in 2017 for Texas (TX)?
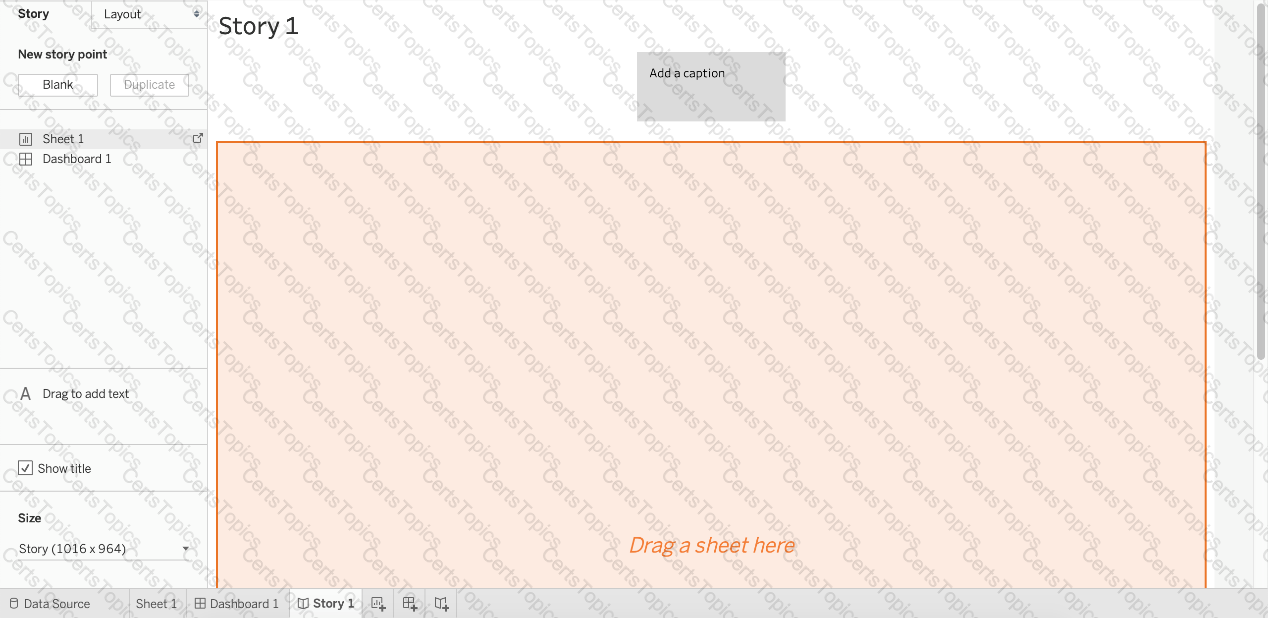
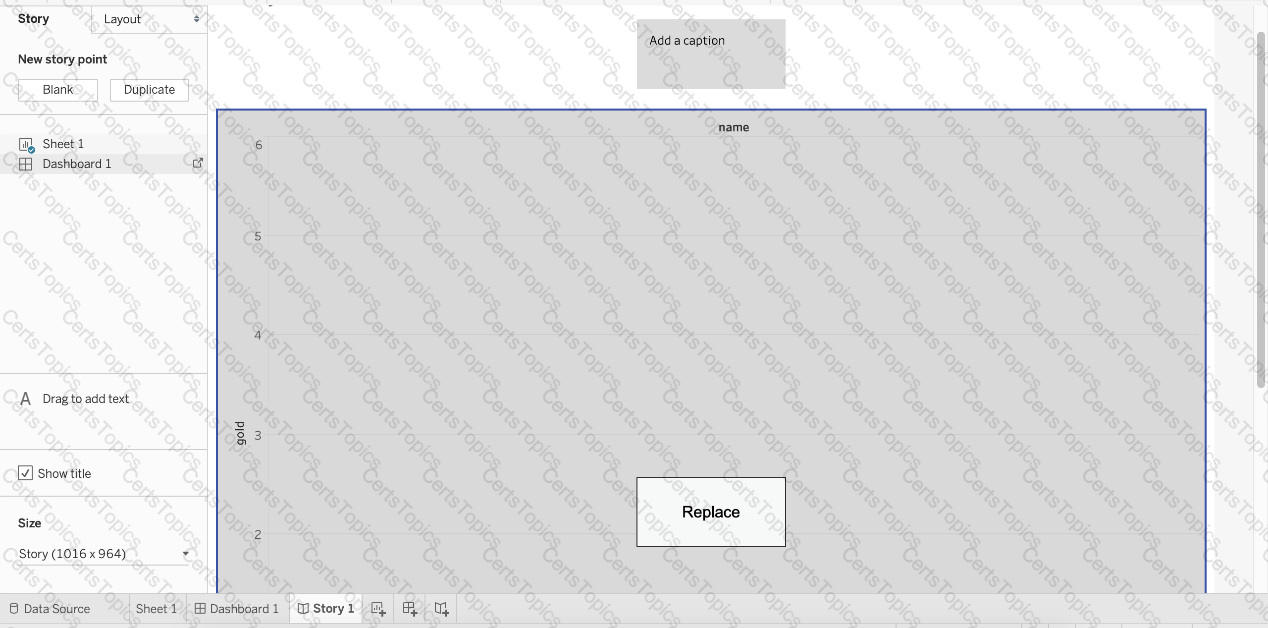
Is it possible to add both a Dashboard and a Worksheet at the same time to a Story Point in Tableau?
Which two types of fields appear blue? Choose two.
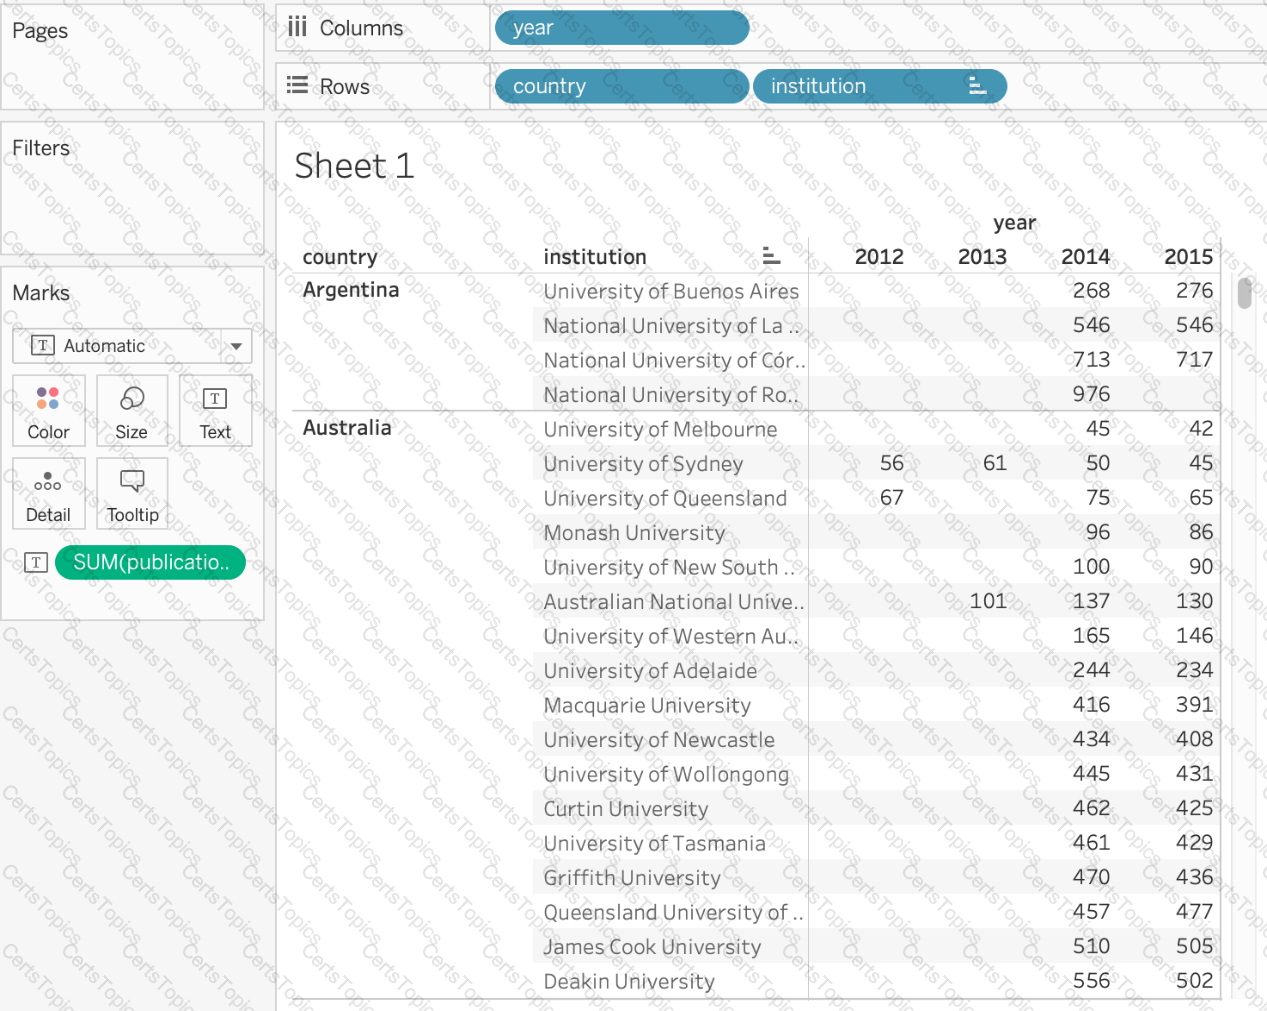
Using the cwurData table, create a cross-tab showing the number of Publications per Country broken down by Institution, and filtered by Country to only show United Kingdown (UK). For the University of Manchester, what percent of the total publications were contributed in 2014?
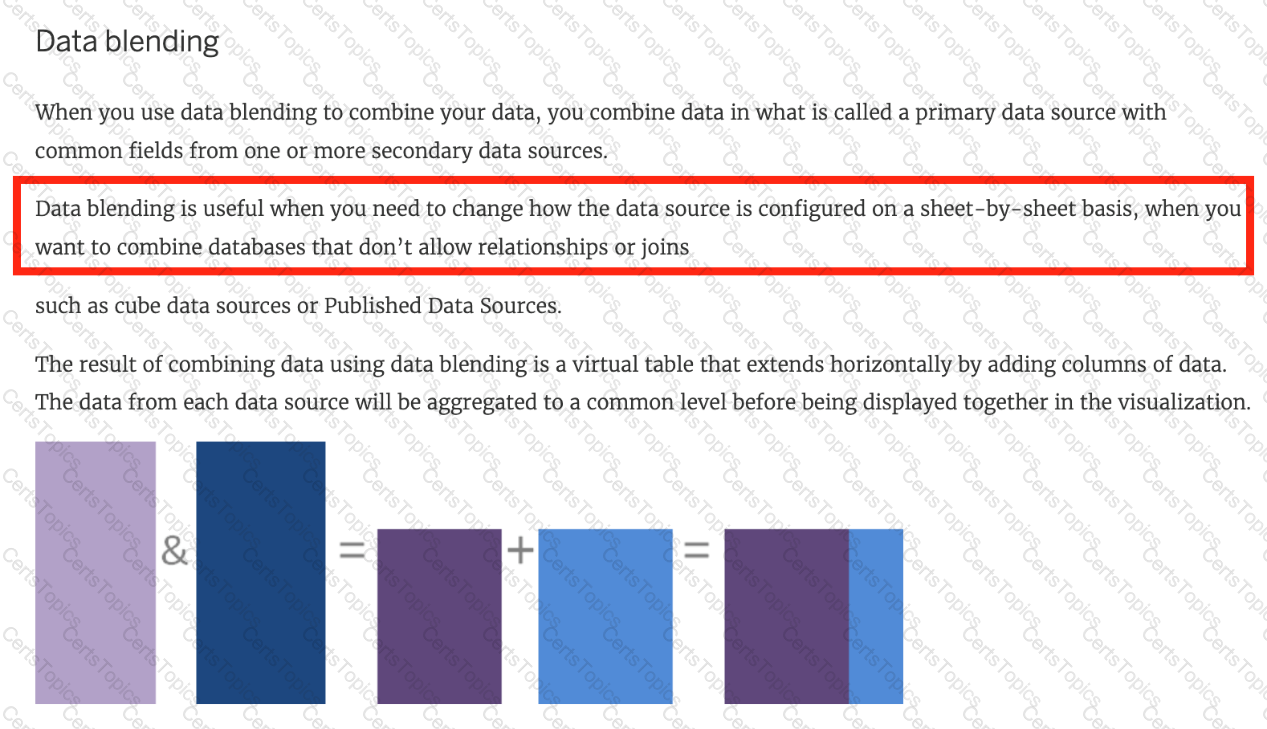
_________________ is useful when you need to change how the data source is configured on a sheet-by-sheet basis, and when you want to combine databases that don’t allow relationships or joins
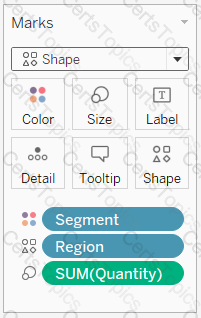
Which of the following would you use to edit the Shape, colour, and Text of your visualisations?
What is a story point in Tableau?
Given a map, which of the following fields can be placed in Size,Shape,Detail,Color
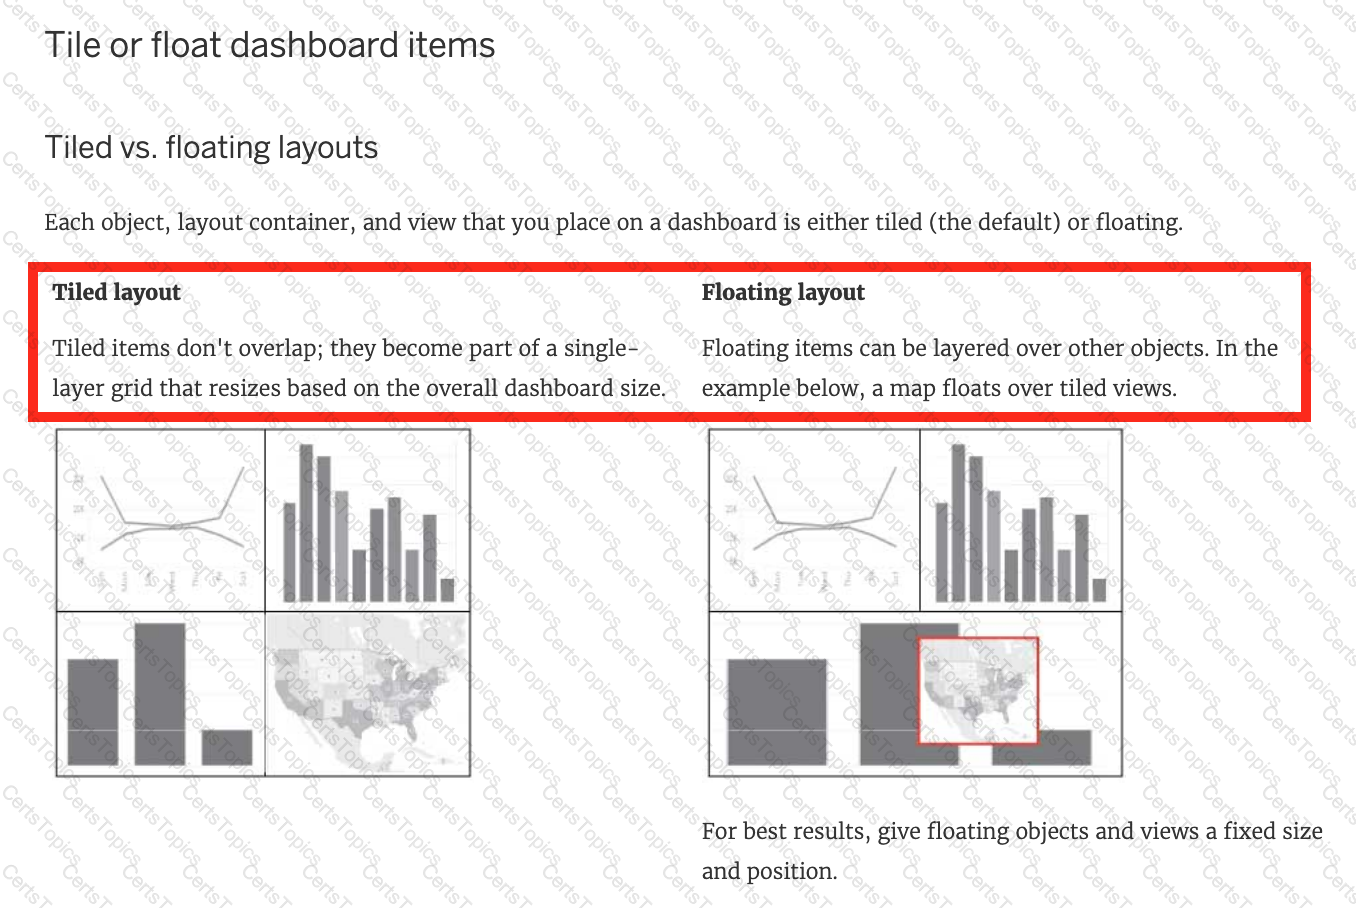
While borders and background colors let you visually highlight items on a dashboard, _________ lets you precisely space items.
Creating a scatter plot requires a minimum of how many measures?
From which three locations can you sort a visualization? Choose three.
Which type of chart can you create without using a dimension?
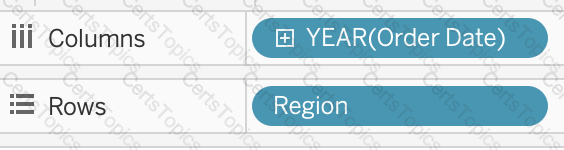
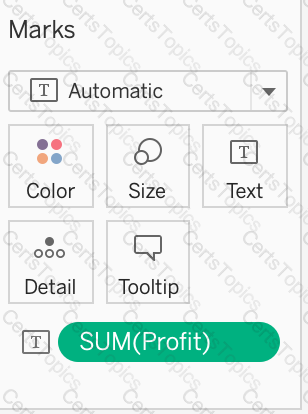
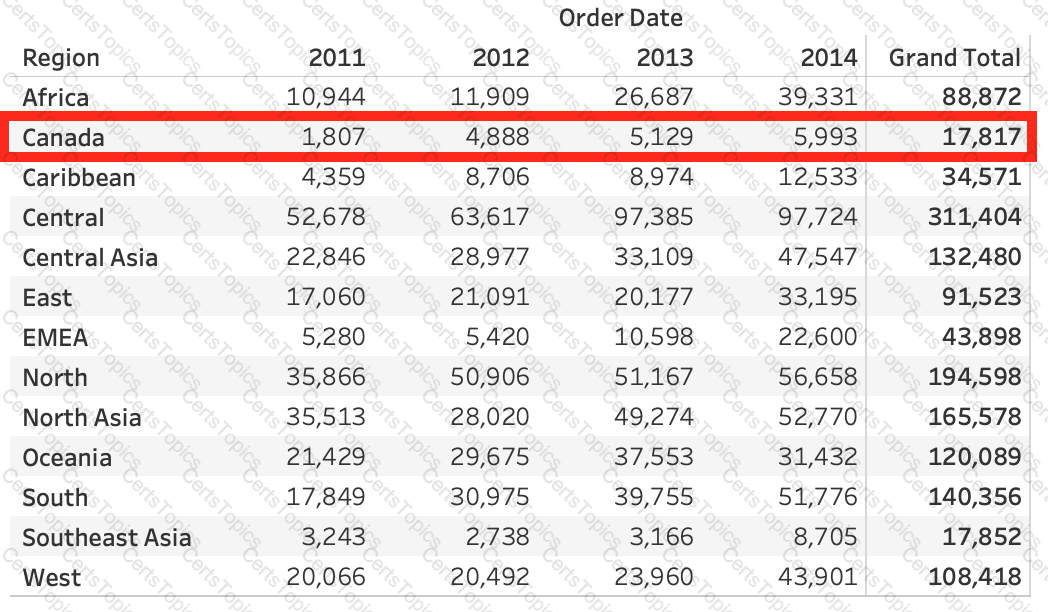
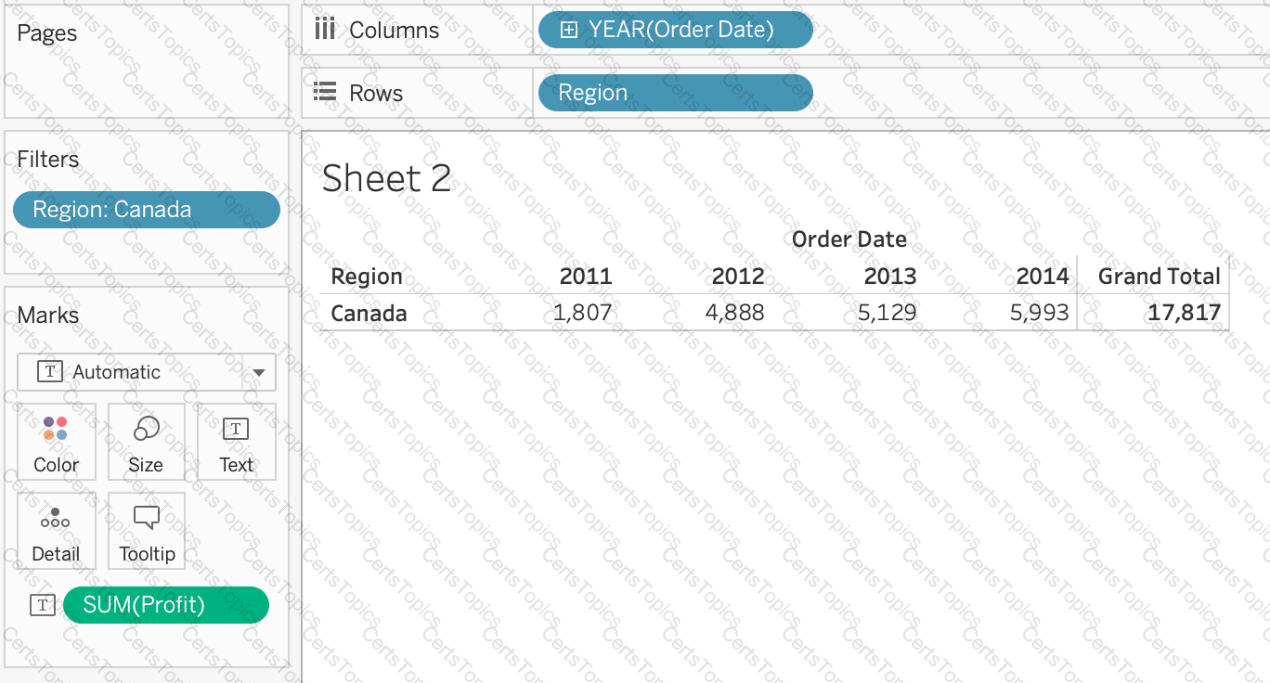
Using the dataset provided, create a crosstab showing the Profit of each Region per Year, then add grand totals to the view. What was the total Profit for Canada in 2012 and the total Profit for Canada for 2011 through 2014, respectively?
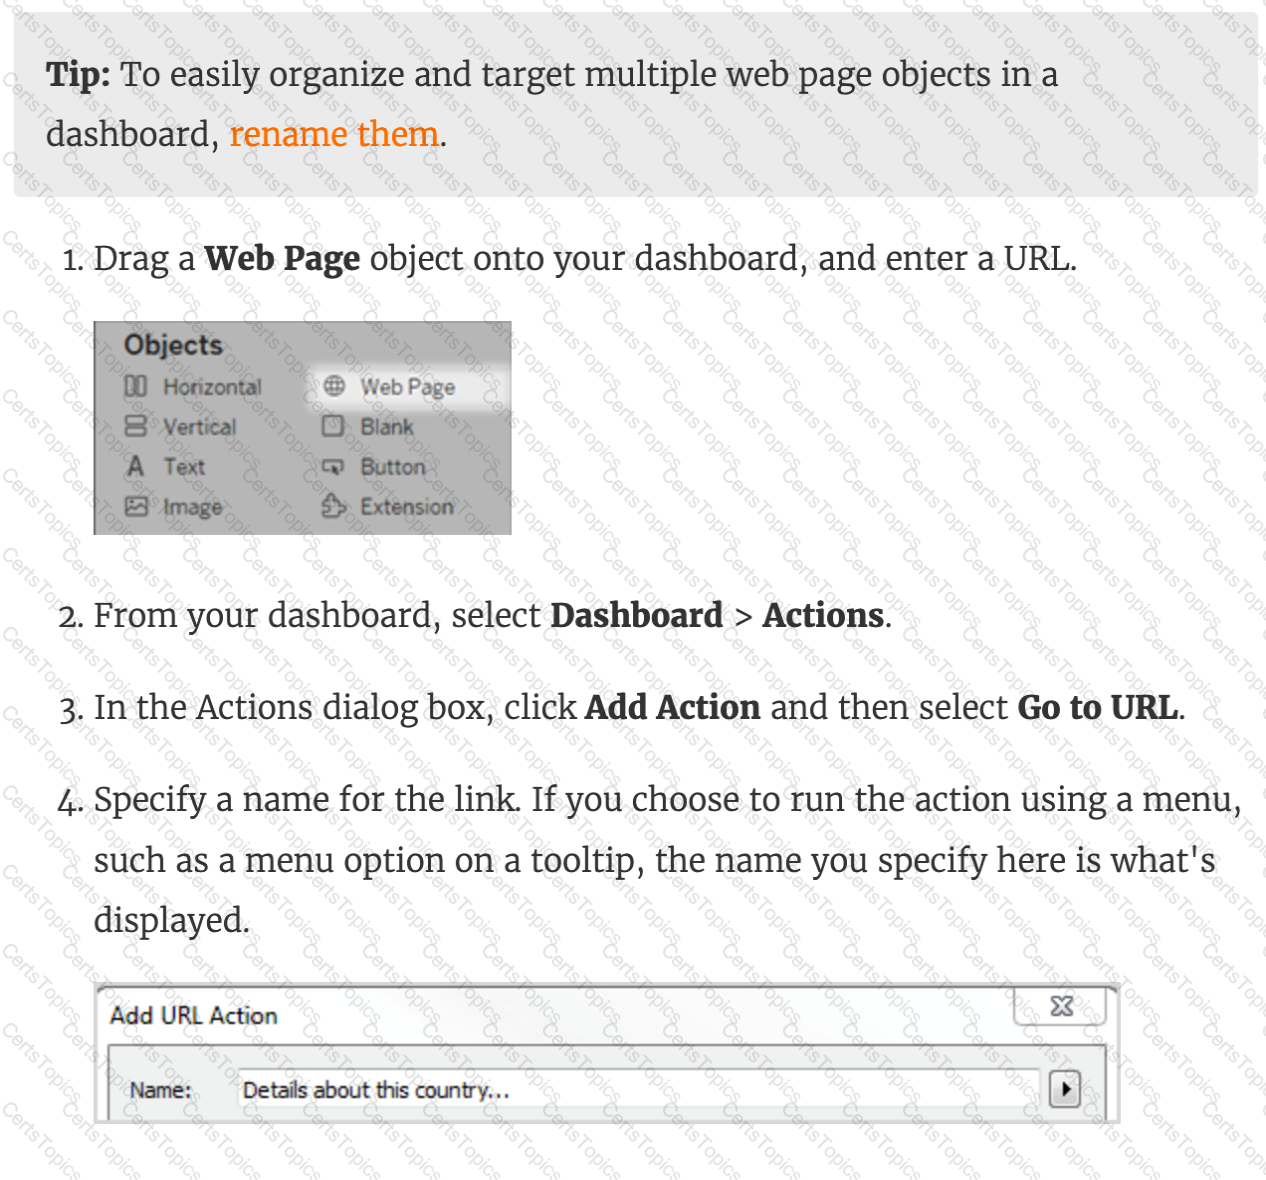
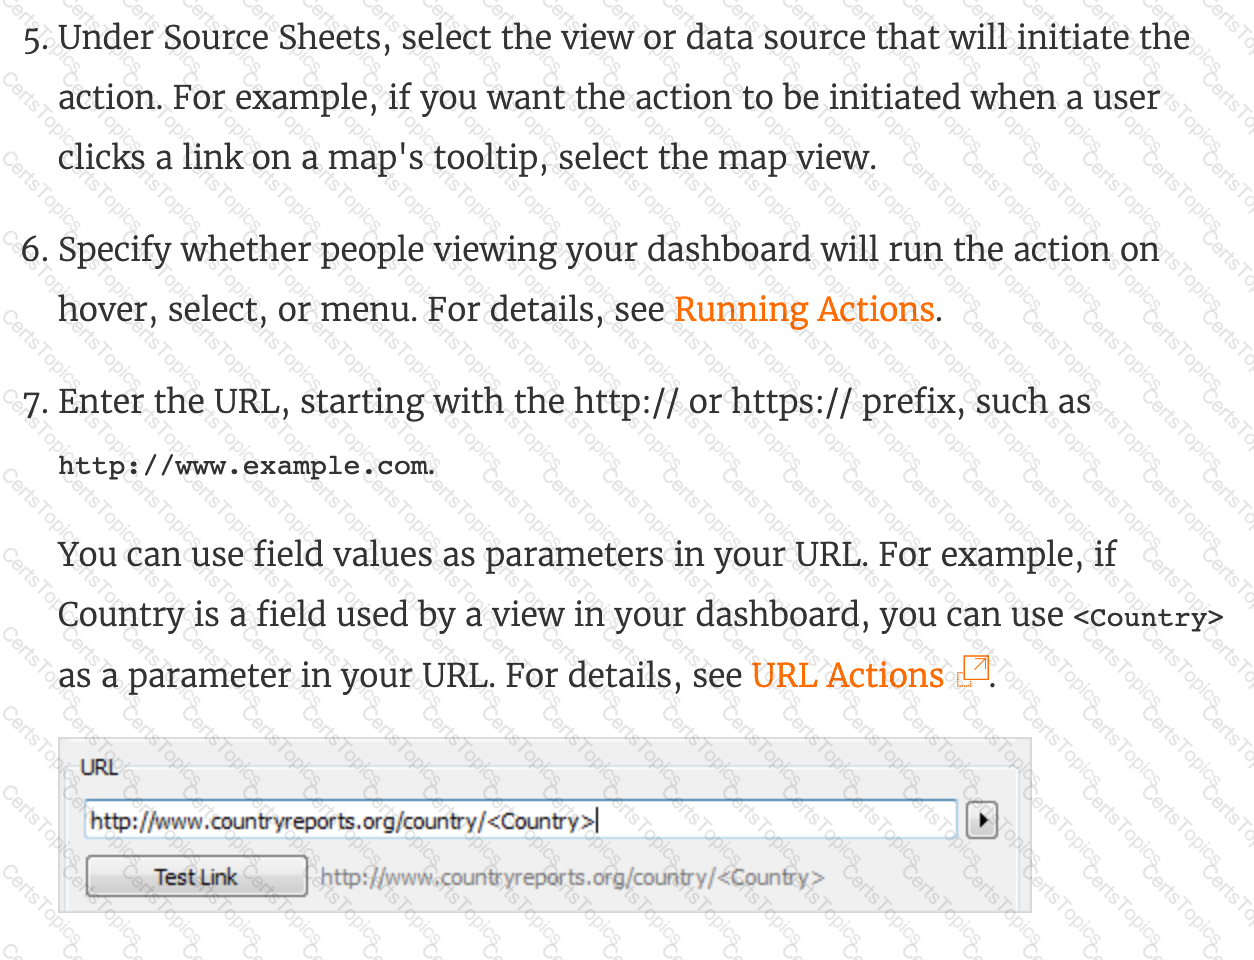
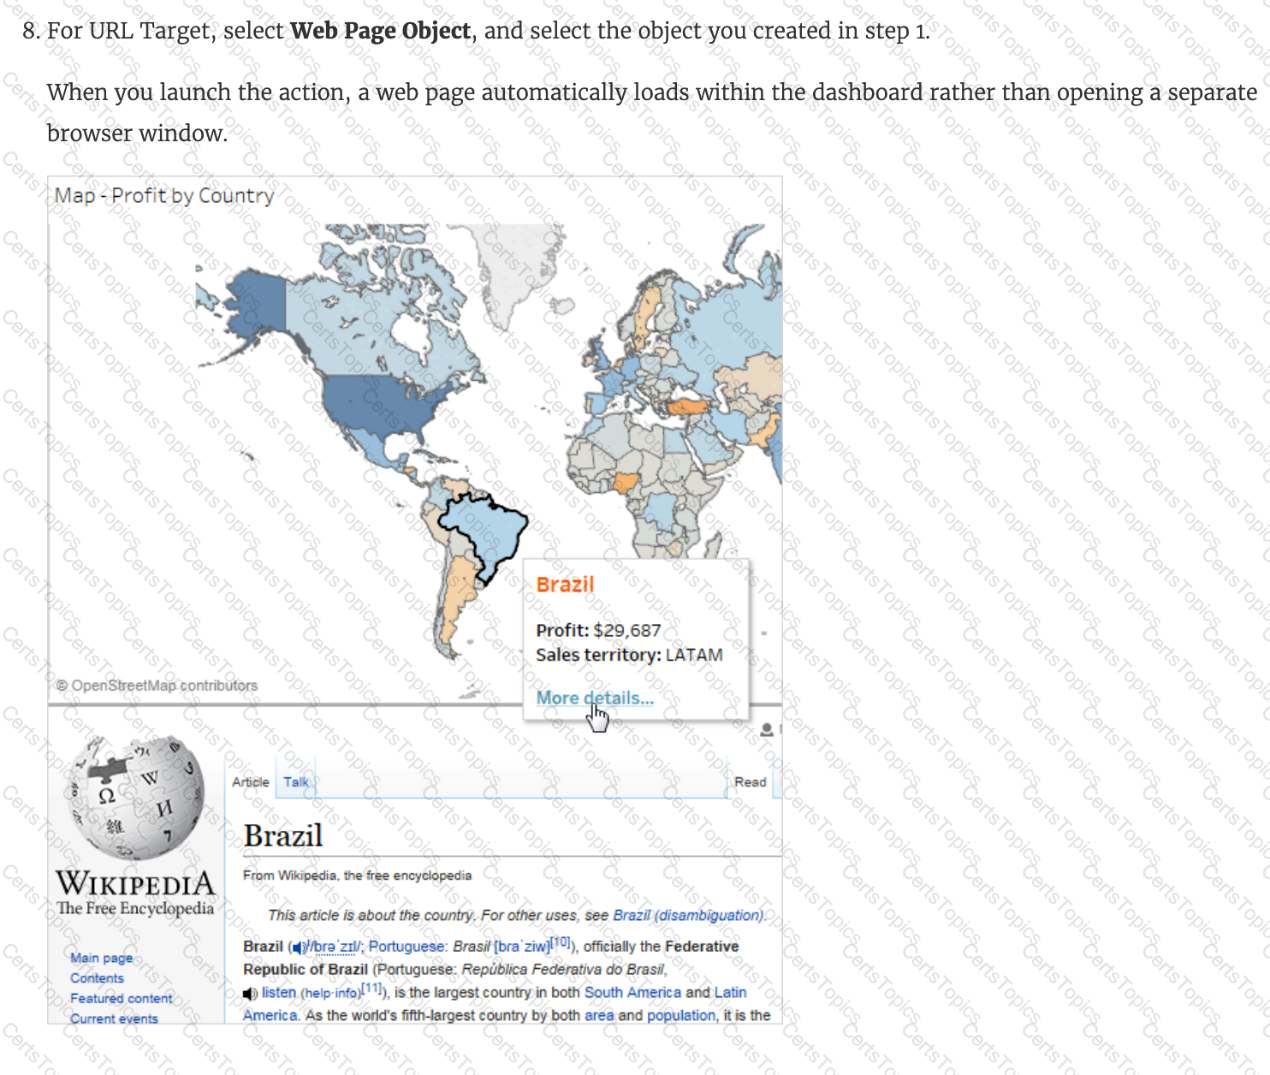
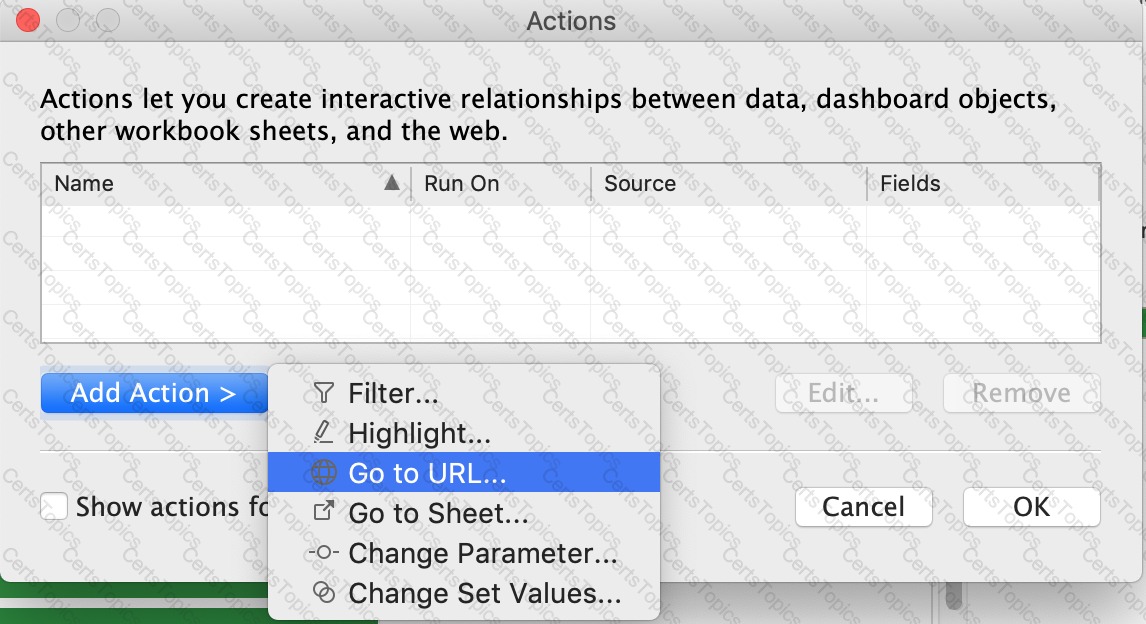
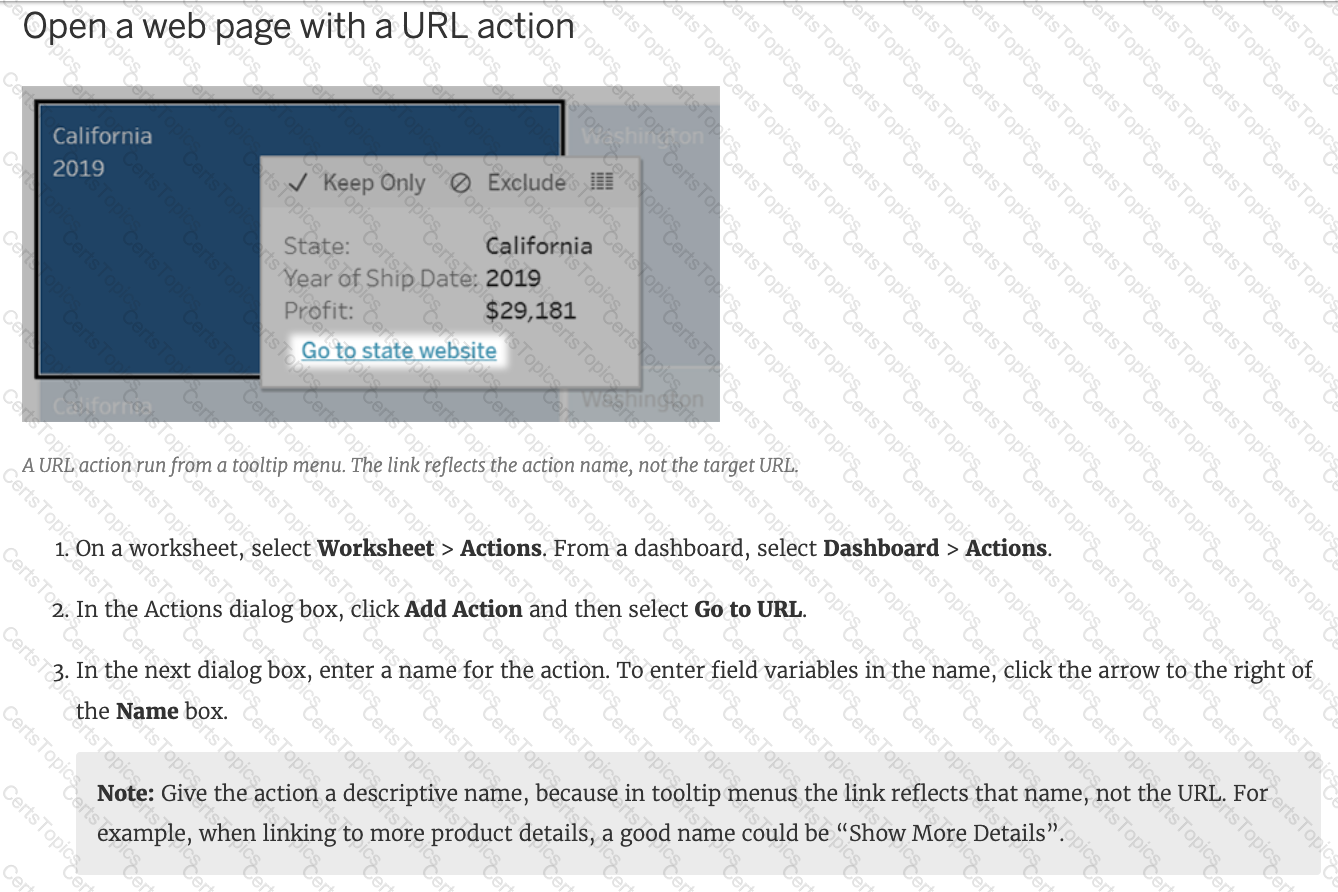
Is it possible to deploy a URL action on a dashboard object to open a Web Page within a dashboard rather than opening the system’s web browser?
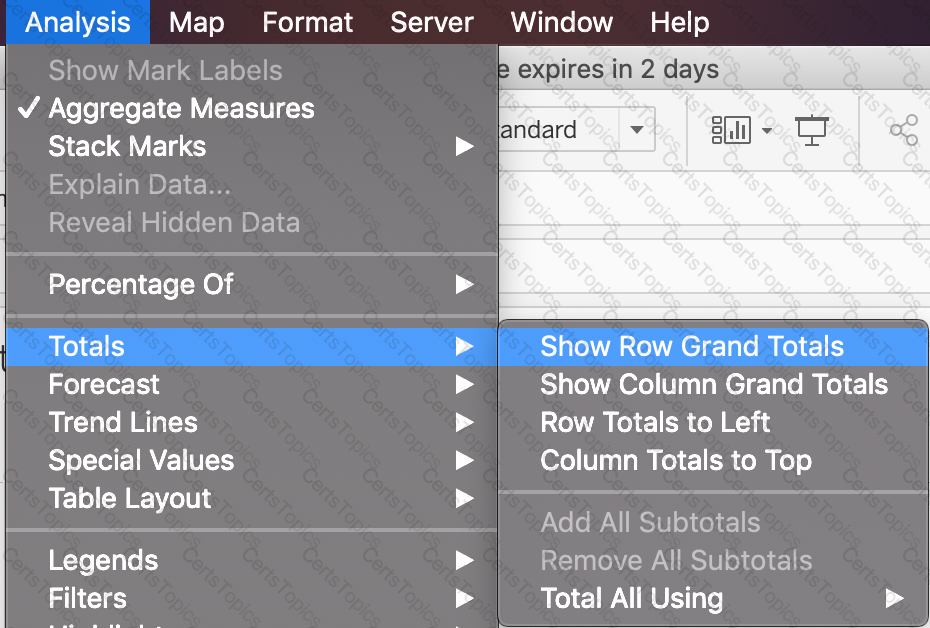
Which of the following are valid ways to add Totals to a view?
Which of the following is a good reason for using a bullet graph?
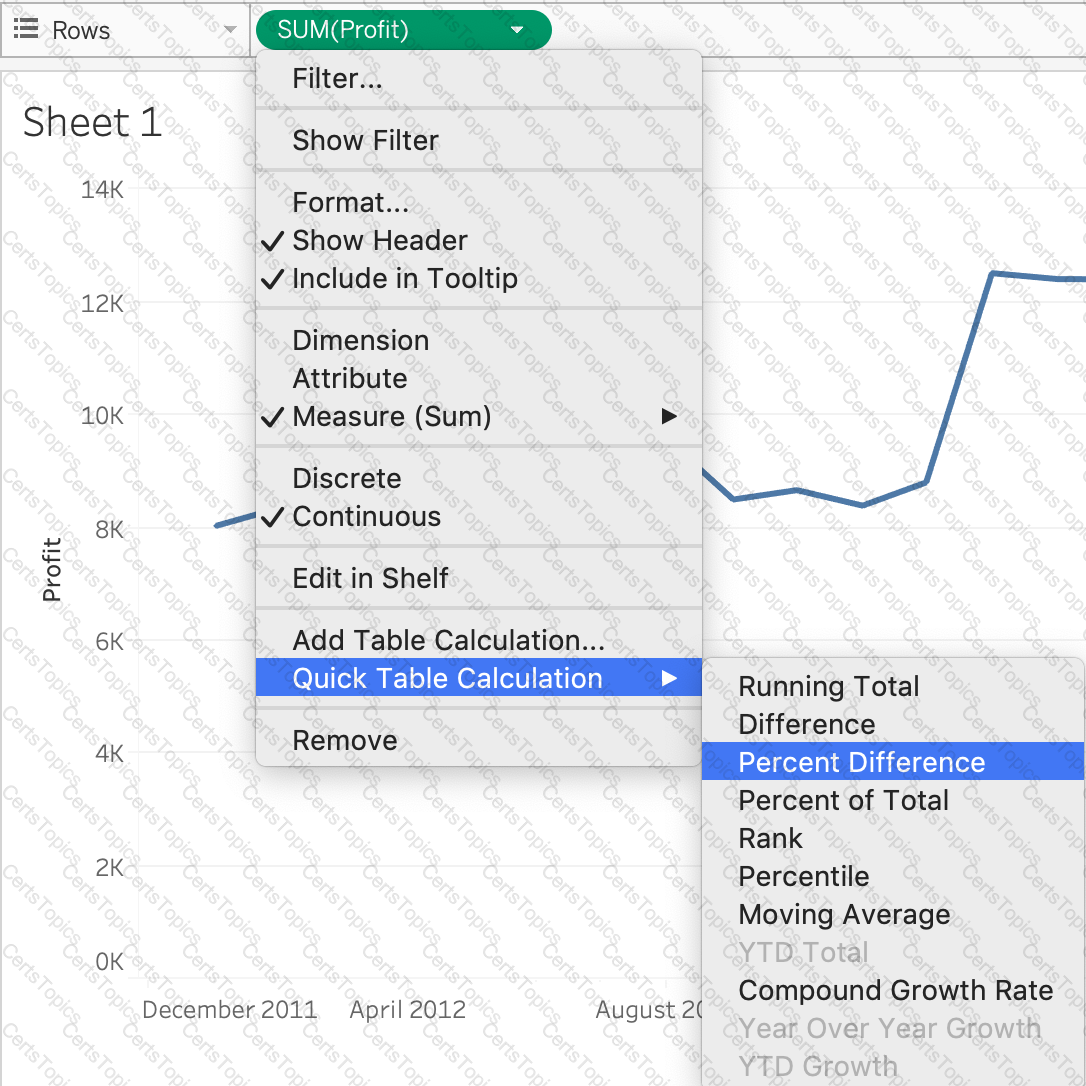
When viewing quick table calculations, such as Percent Difference From, that use a value in the previous column, what will be the first data value in the visualization?
You have the following legend.
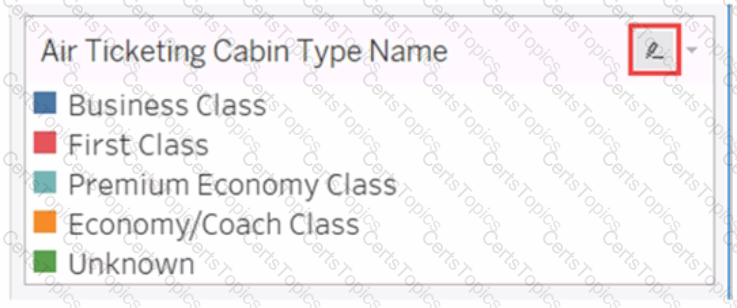
What occurs when you click the icon to the right of Air Ticketing Cabin Type Name?
Which of the following is a benefit of using a Tableau Data Source (.tds)?
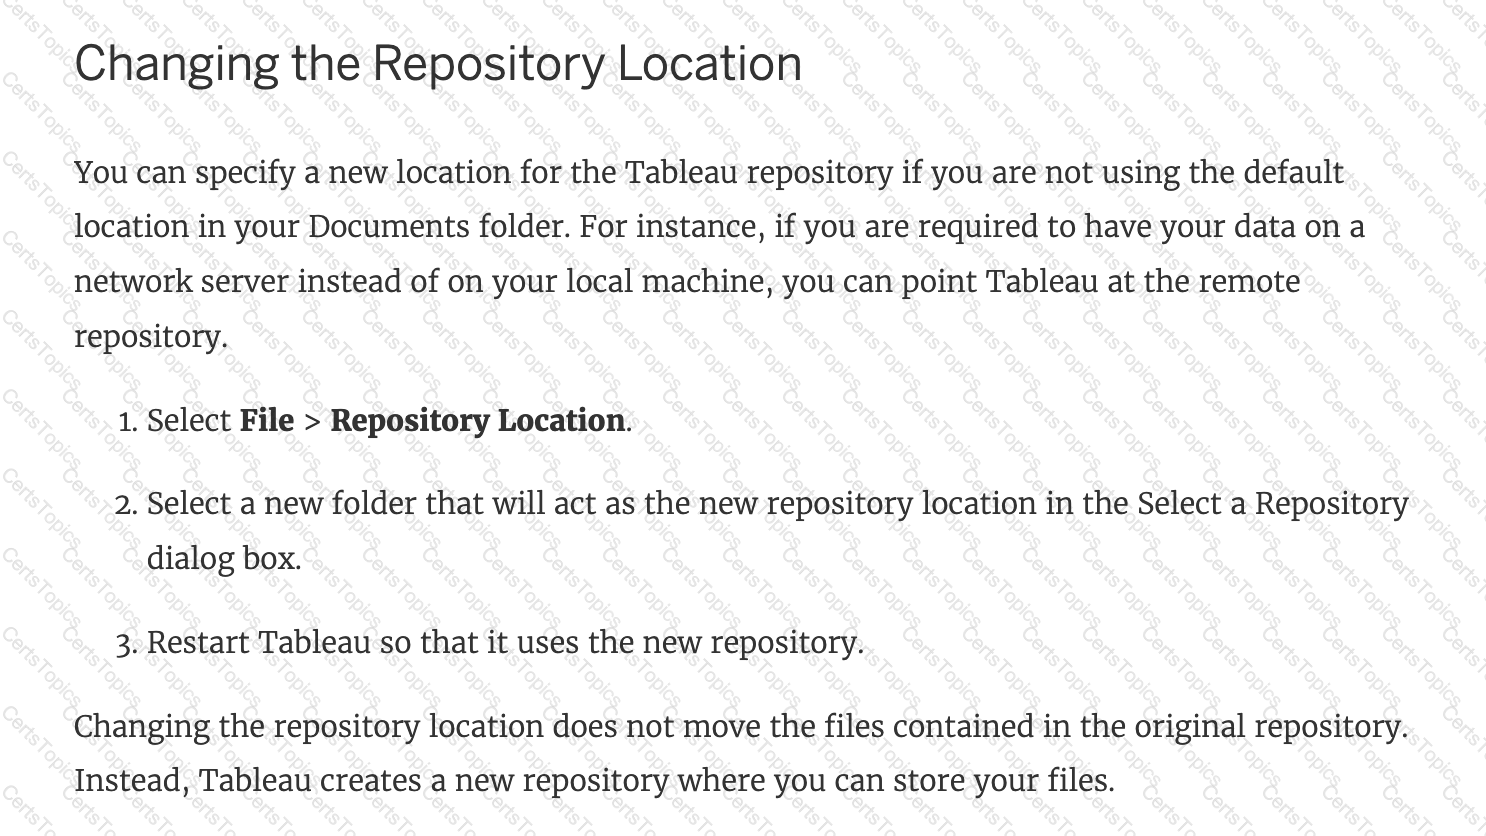
How can you change the default Tableau repository location?
When using a data source that has relationships, how can you add a join between two or more tables?
True or False: Sets can be created on Measures
If you use a percent difference Quick Table Calculation, what value will be the first data value?
True or False: It is possible to change the Geographic Role of a dimension
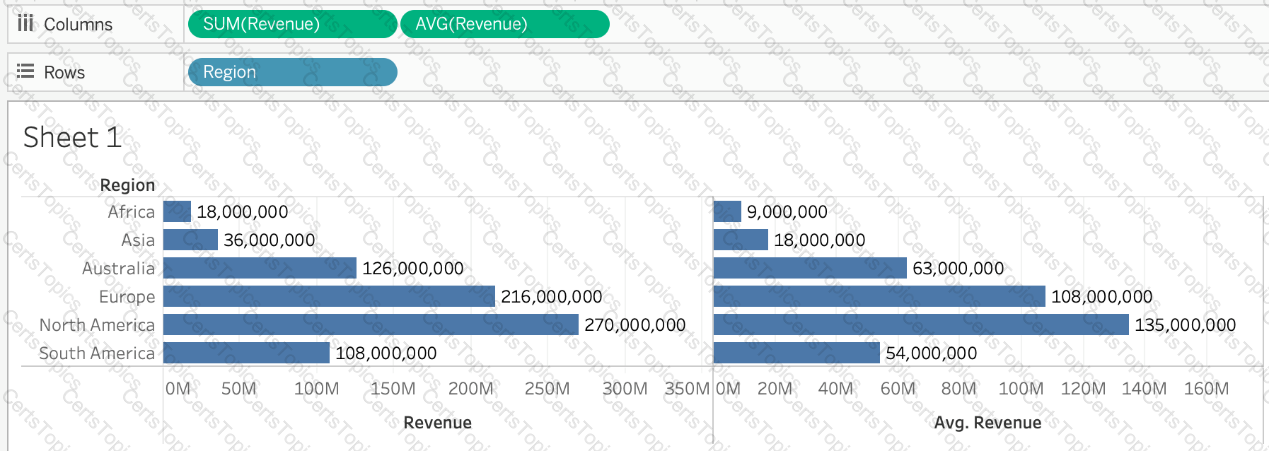
Is it possible to use measures in the same view multiple times (e.g. SUM of the measure and AVG of the measure)?
You have the following visualization.
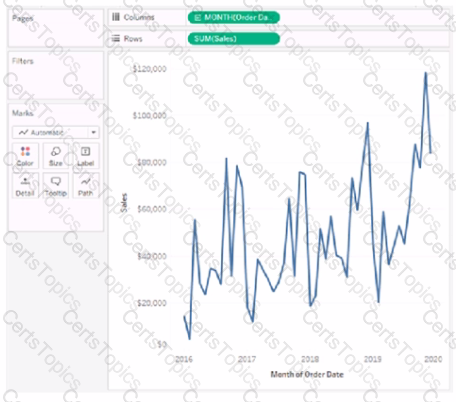
Where should you place a field named Region to show multiple distinct lines on the same axis?
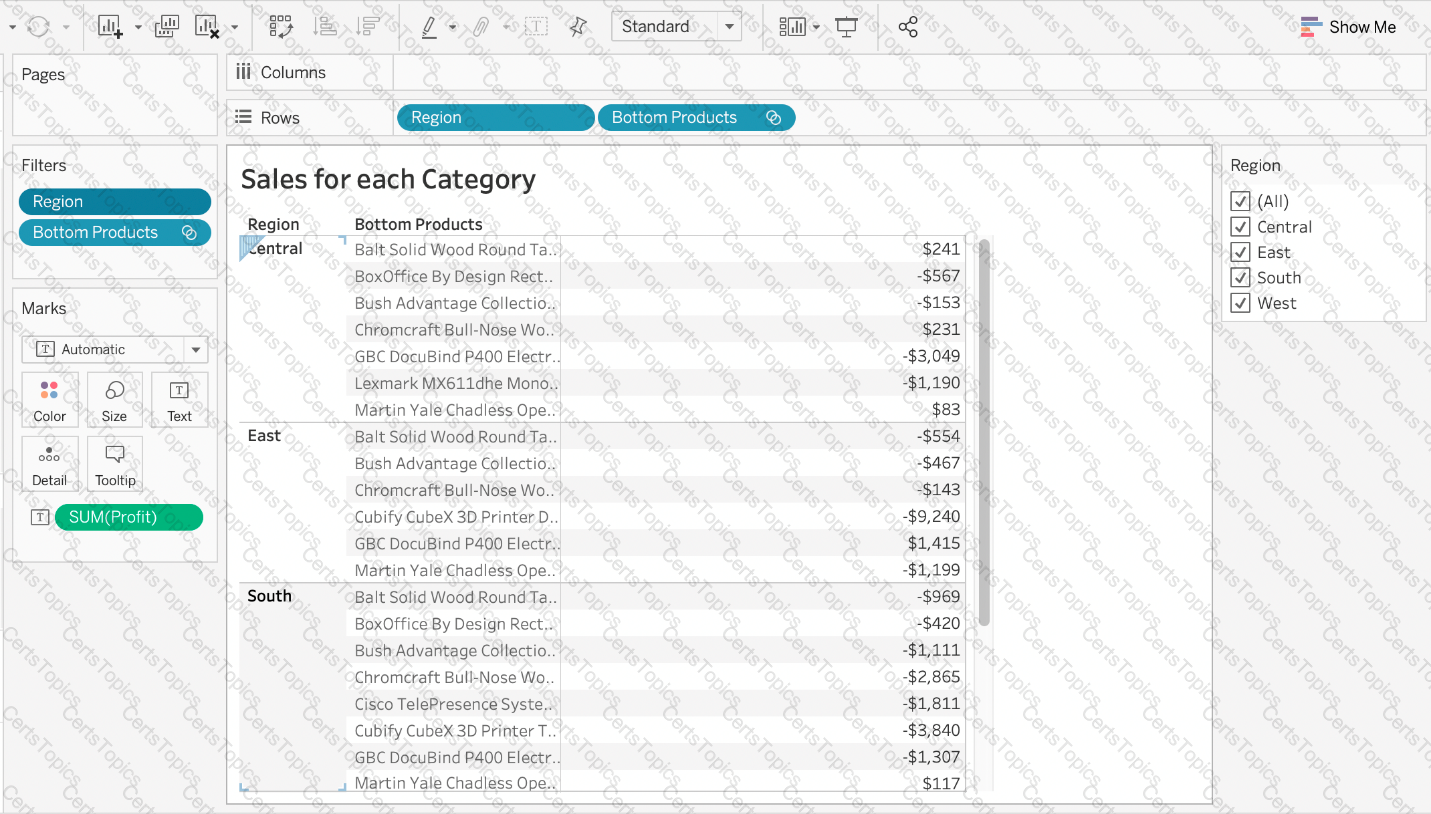
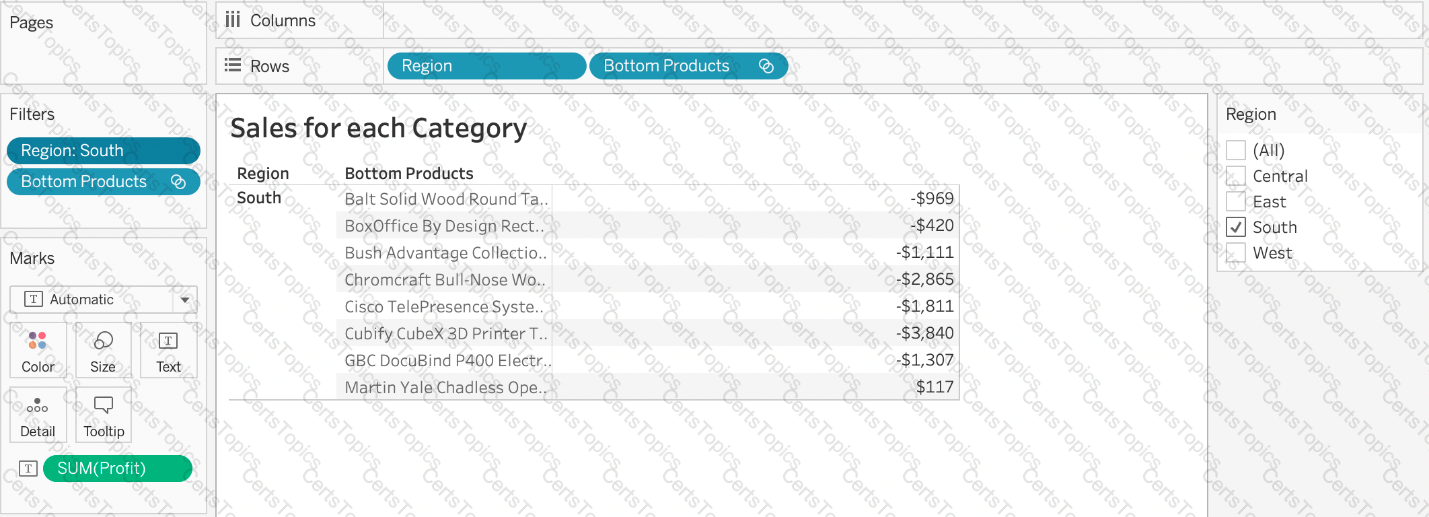
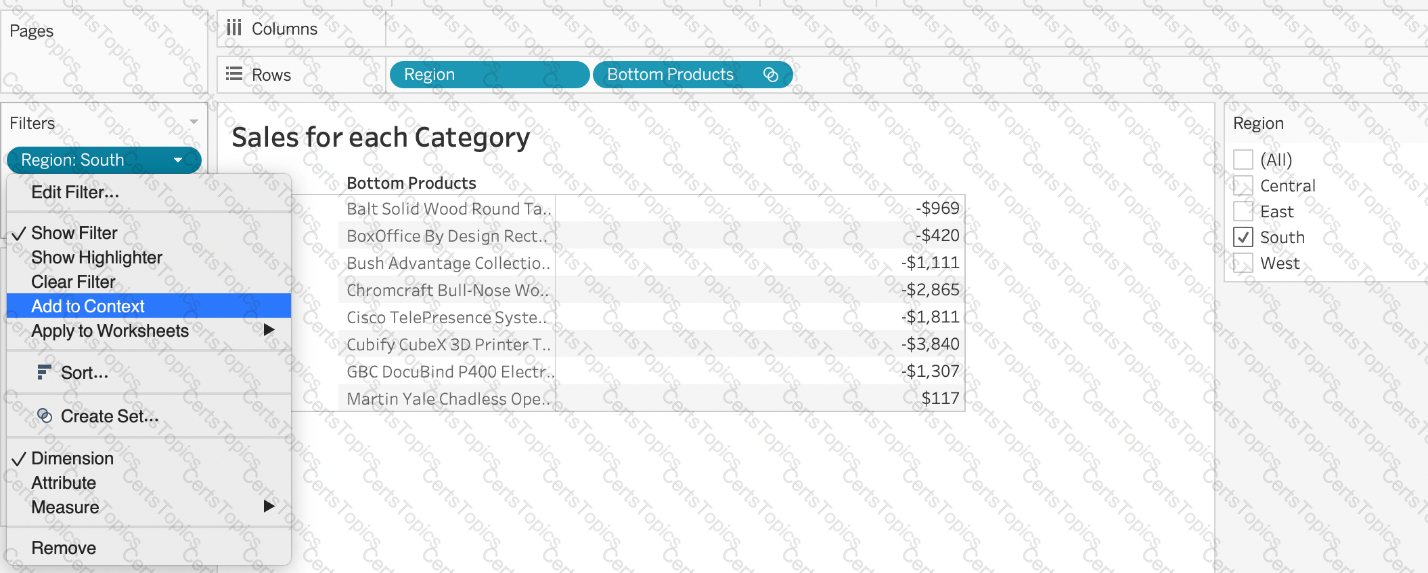
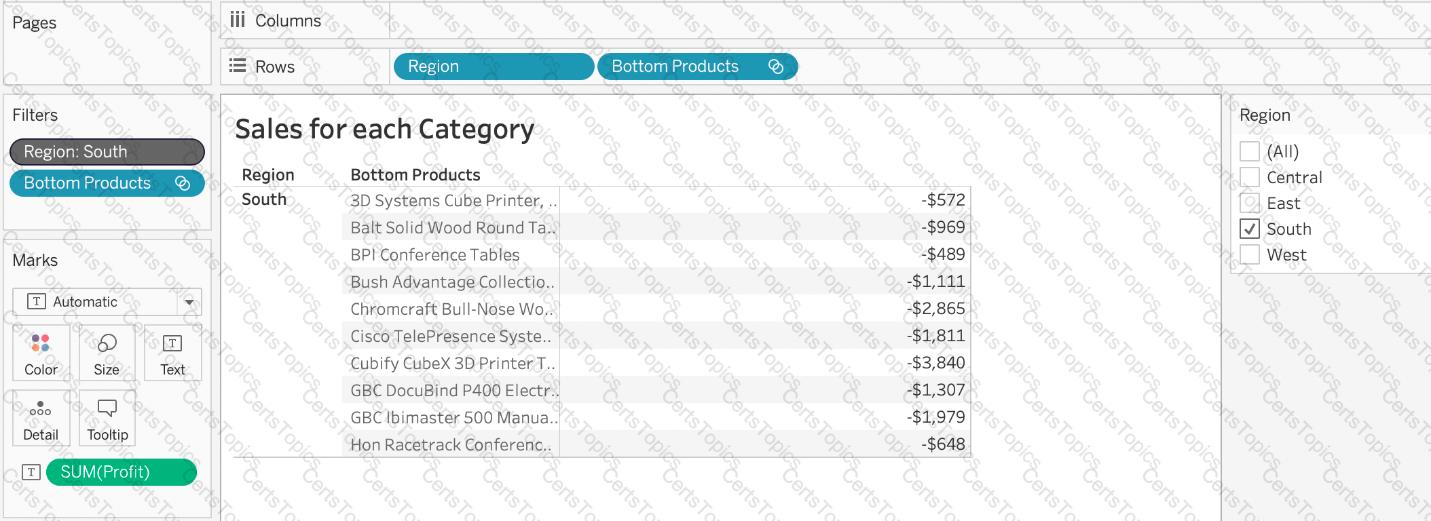
Our use case states that we need to create a set showing the Bottom 10 products by Profit in each Region. Which of the following filter types should you apply on Region?
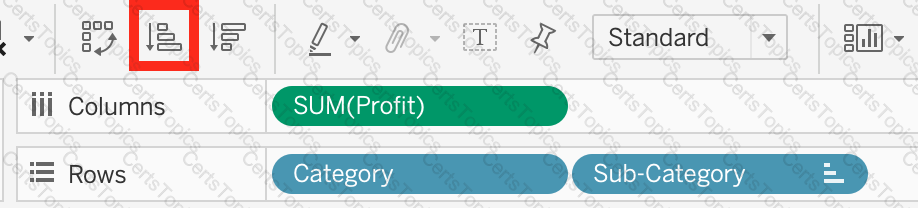
What does the following icon do in Tableau?
Larger image
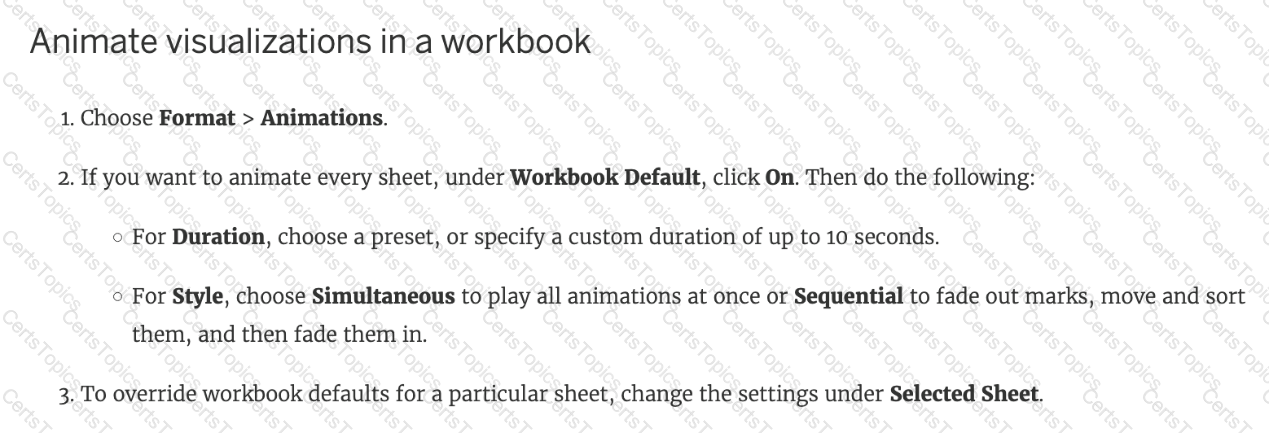
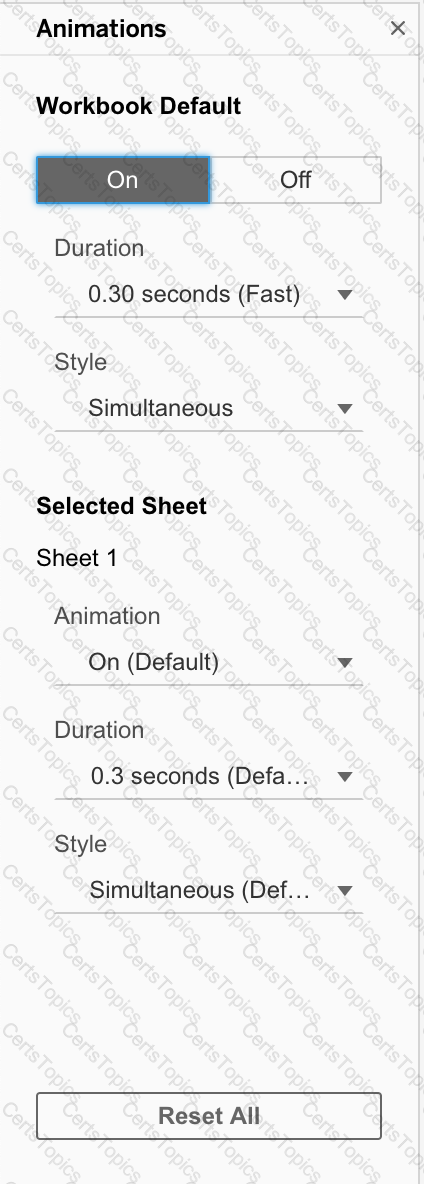
When using Animations in a Tableau, which of the following is the default duration for animations?
What are two use cases for creating hierarchies from the Data pane? Choose two.
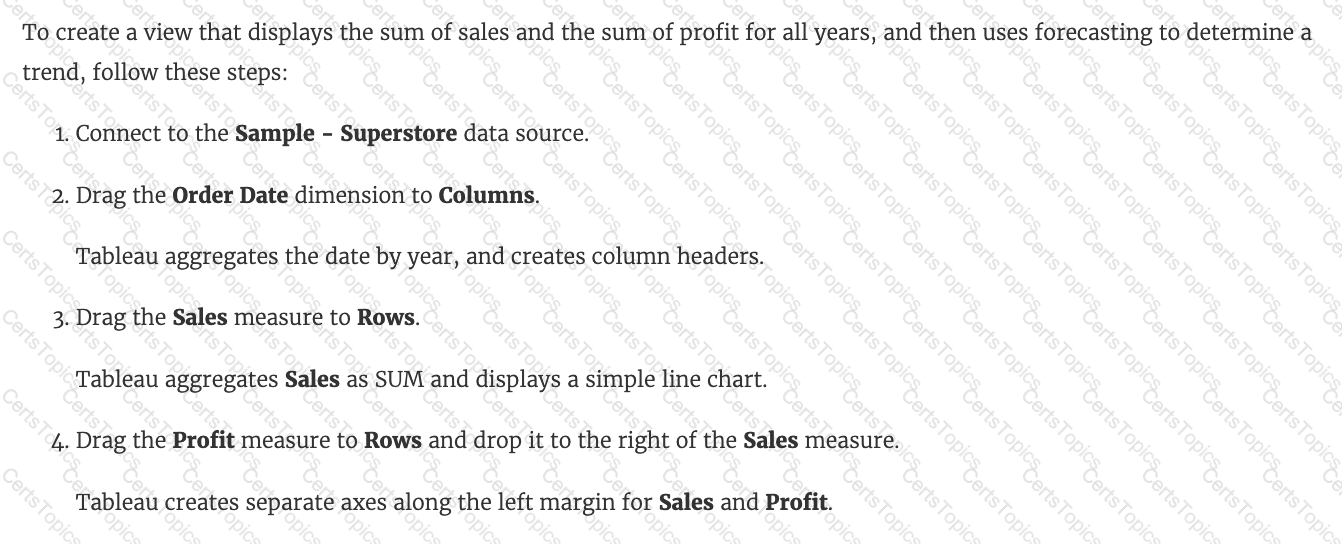
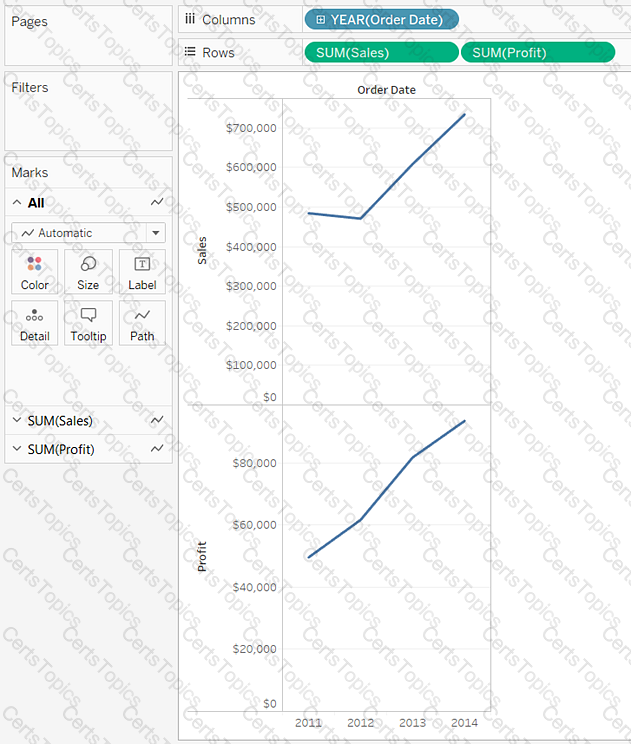
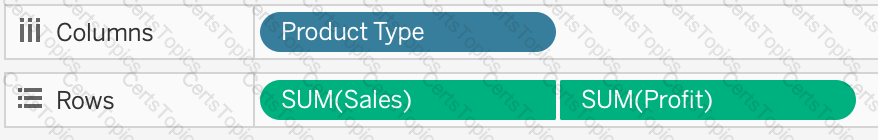
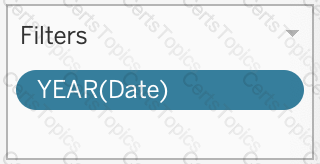
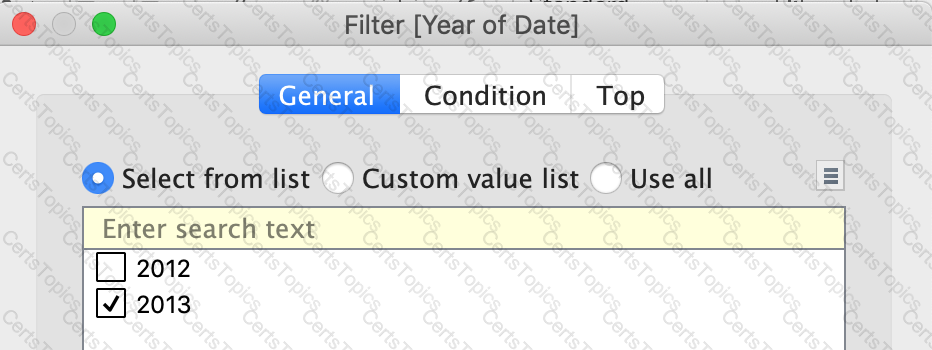
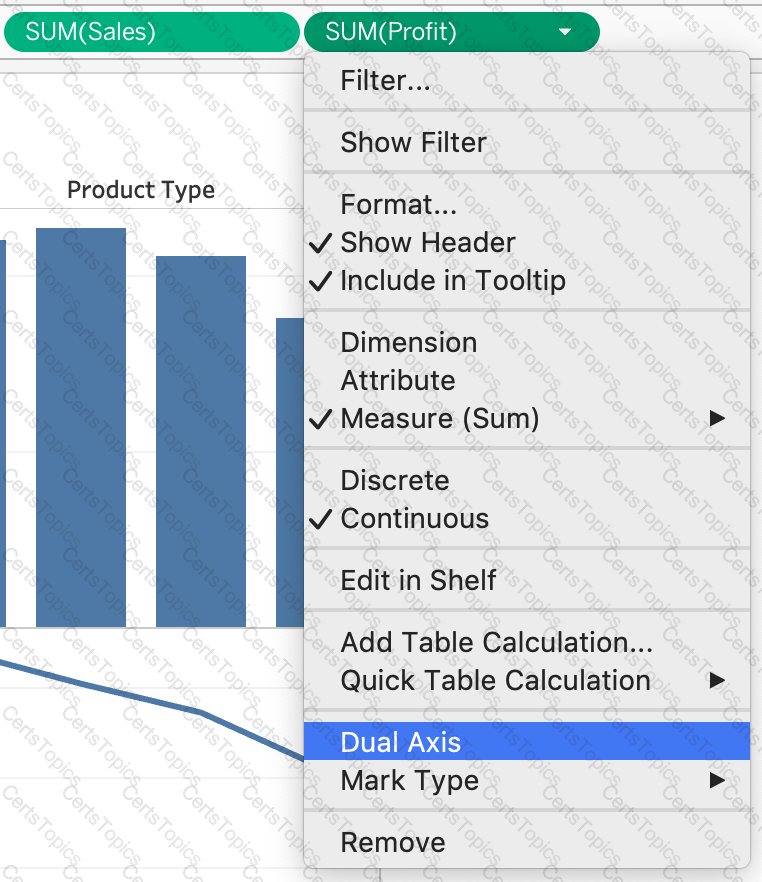
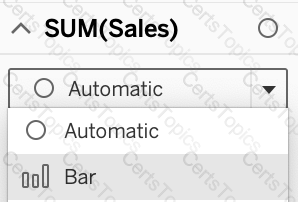
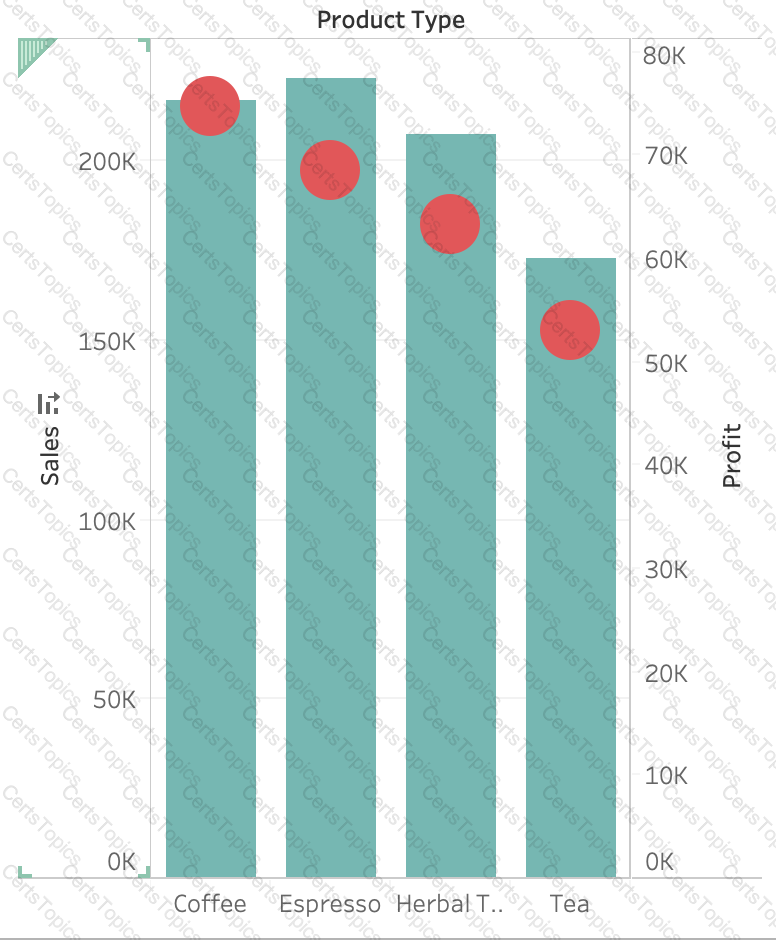
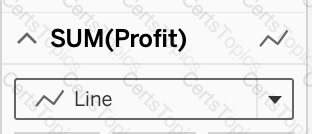
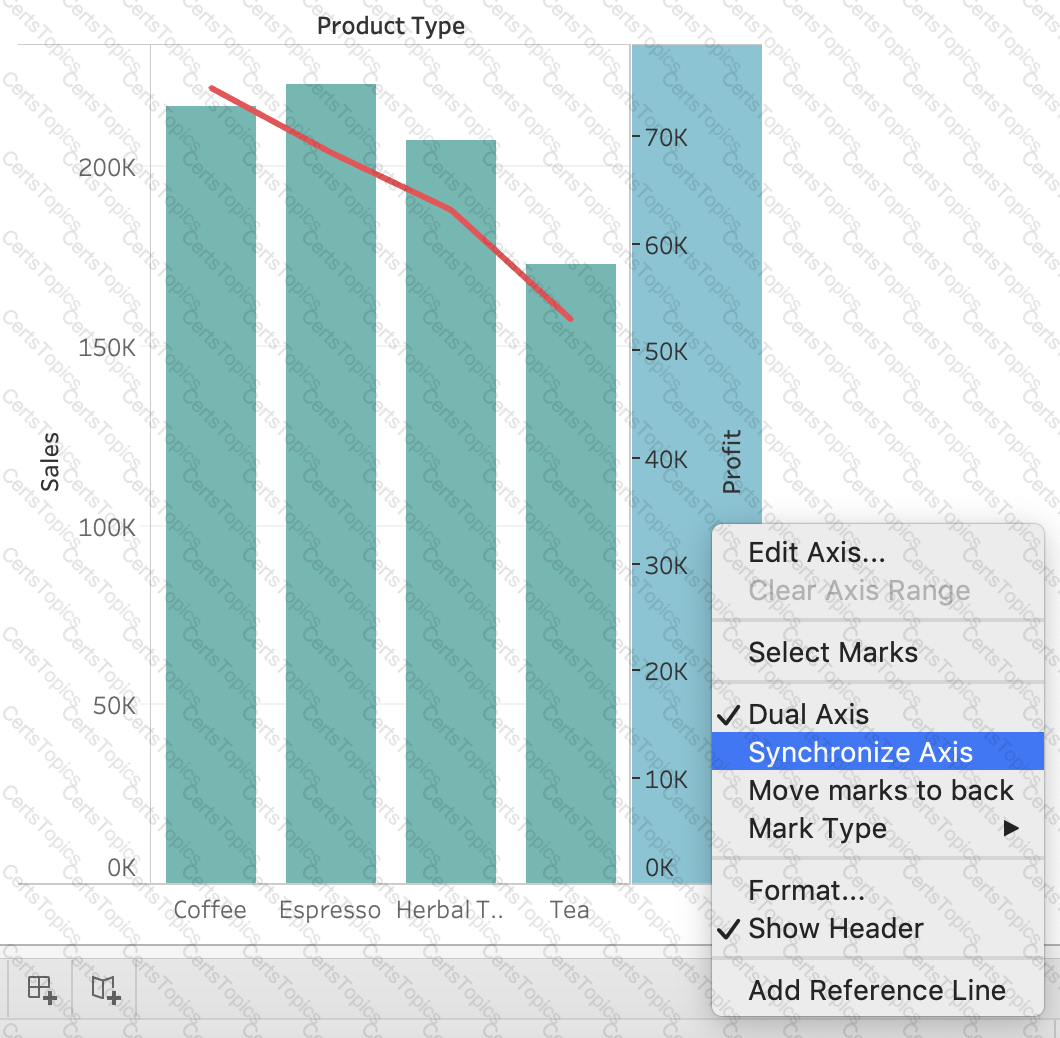
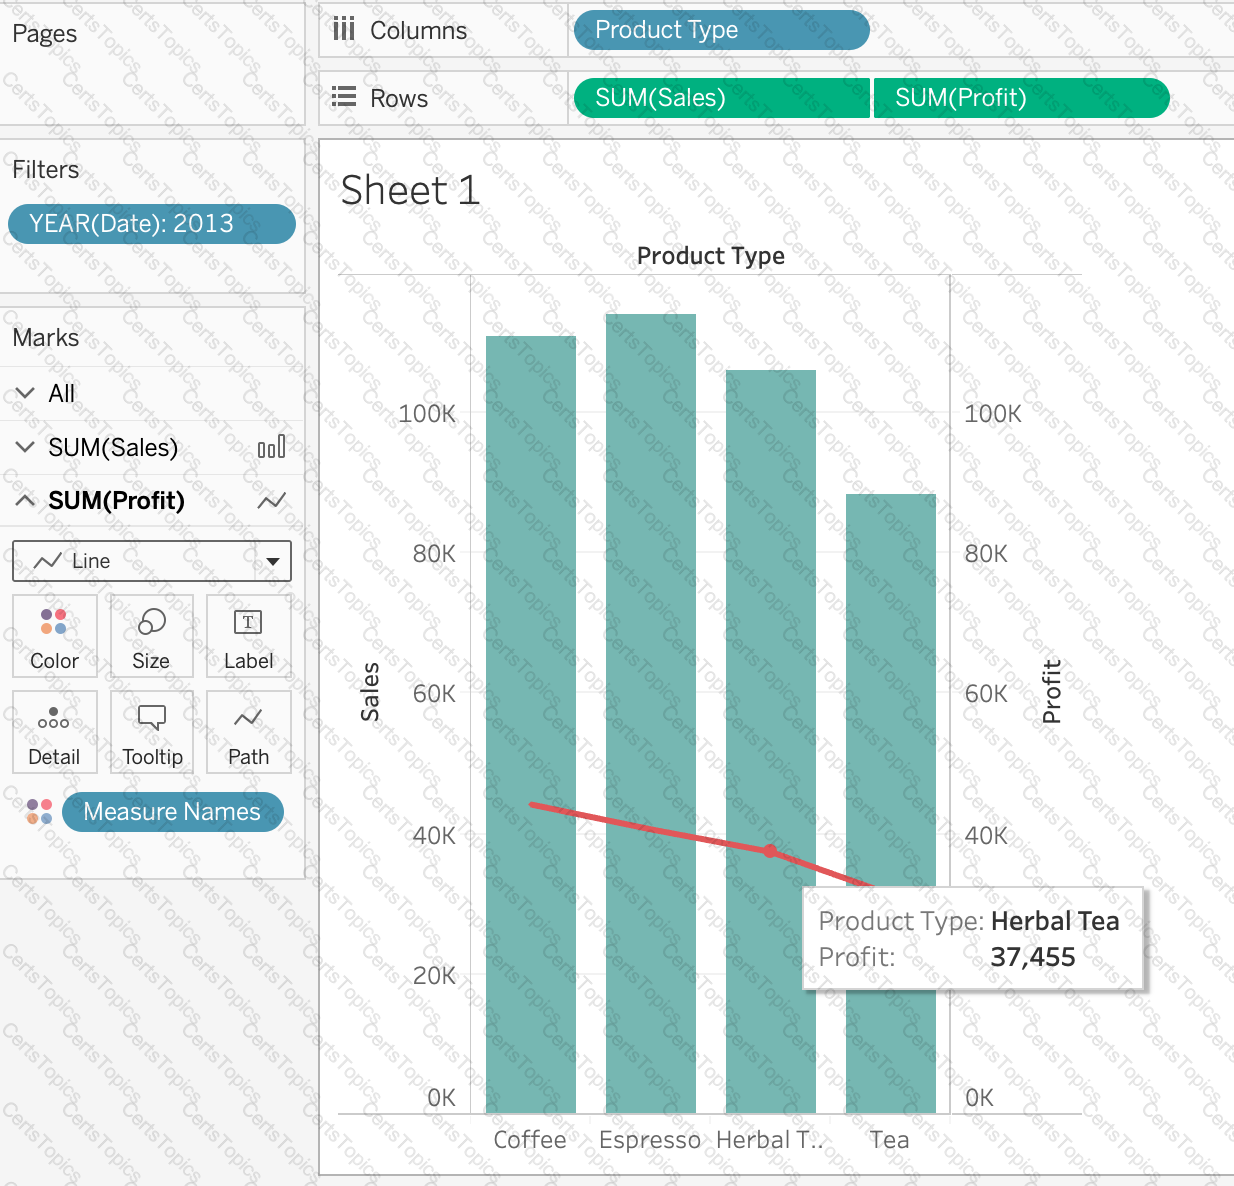
Using the CoffeeChain table, create a Dual Axis chart showing the Sales (Bar chart) and Profit (Line Chart) for each Product type. What was the Profit for the Herbal Tea product type in 2013?
Which two functionalities can you provide to consumers by adding a parameter to a visualization? Choose two.
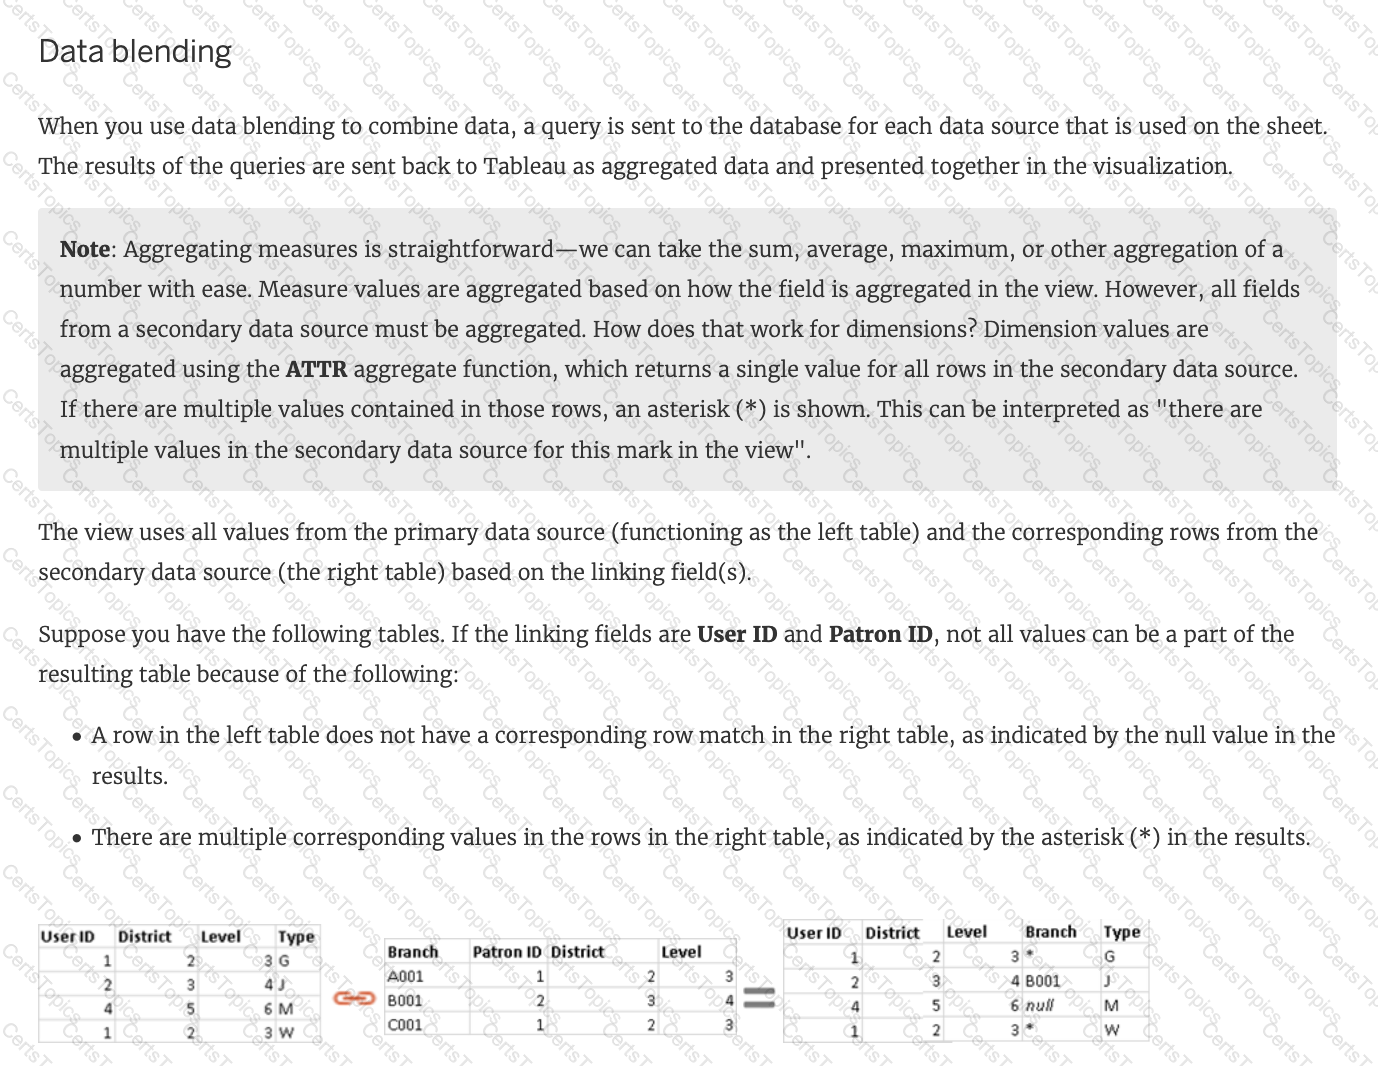
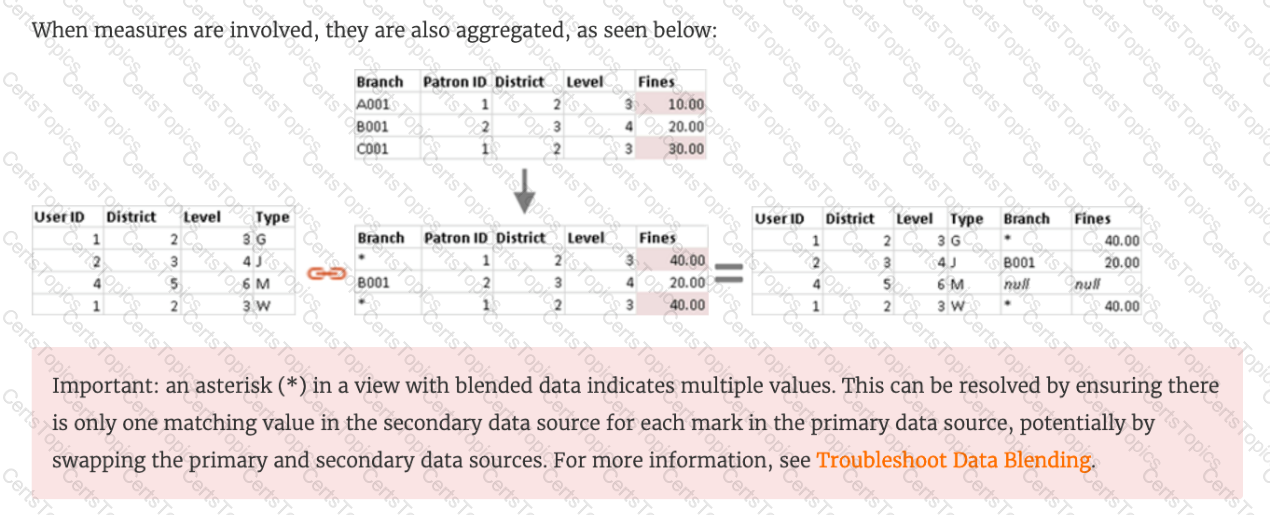
Data blending simulates a traditional _________________ Join
What are two examples of a date value?
Choose two.
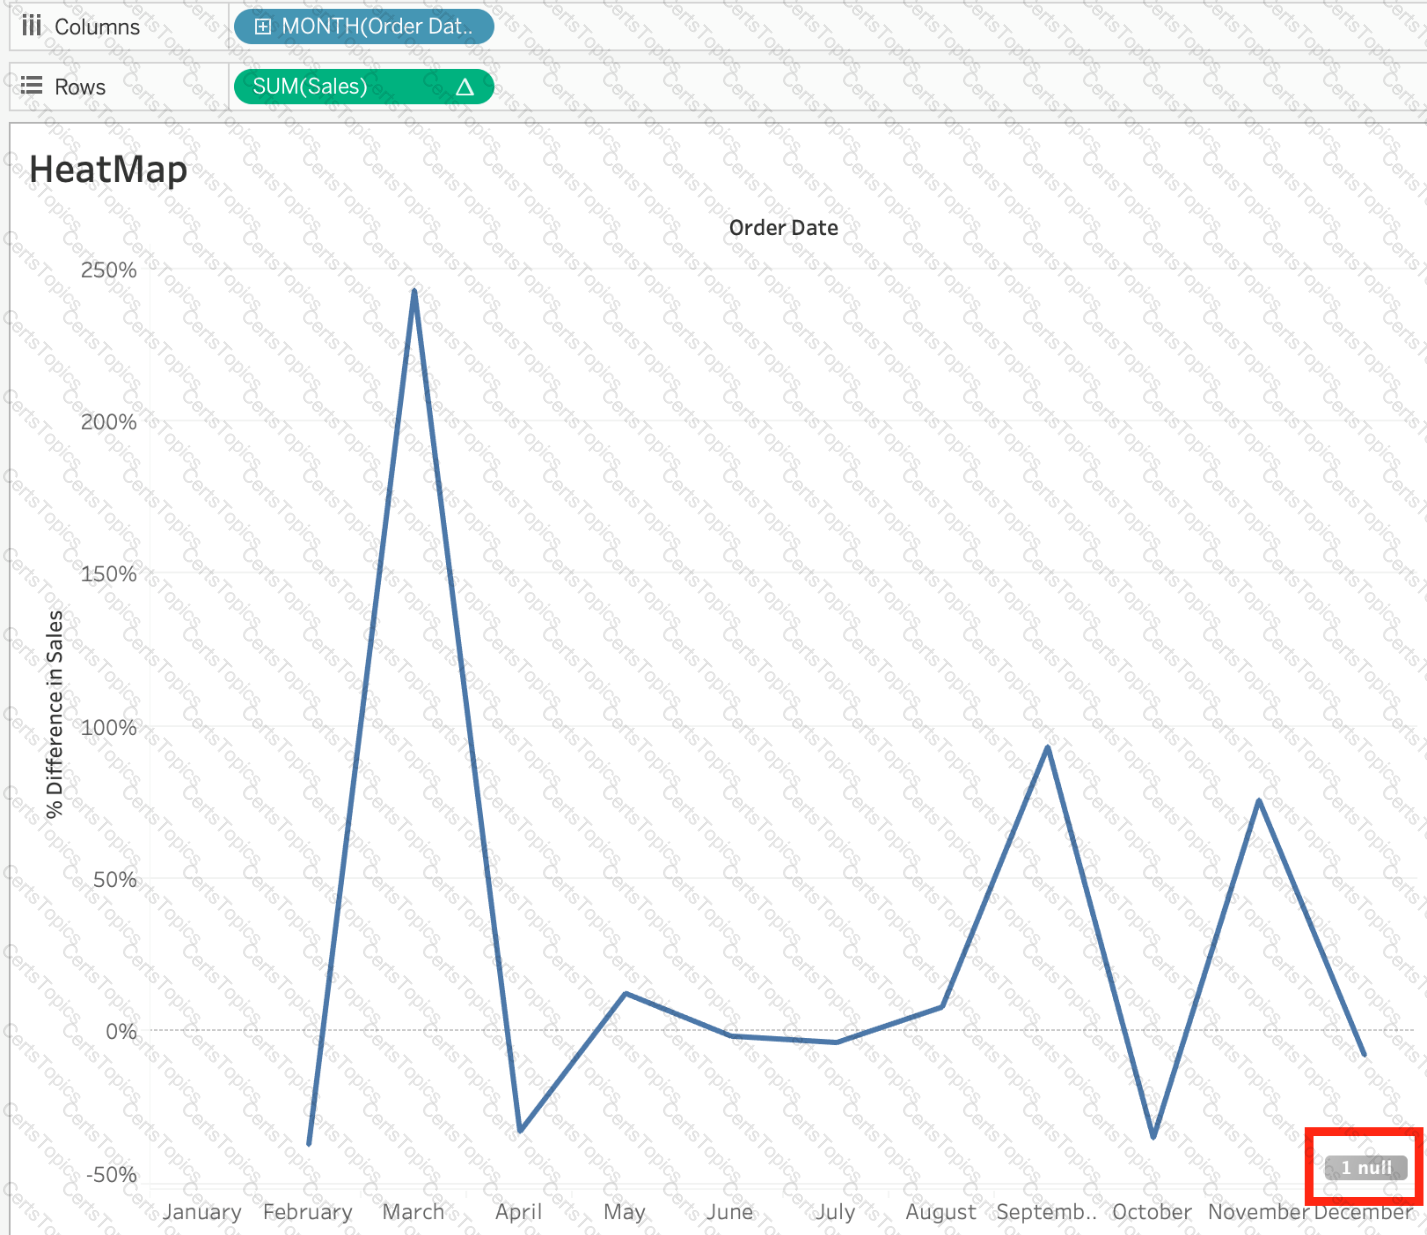
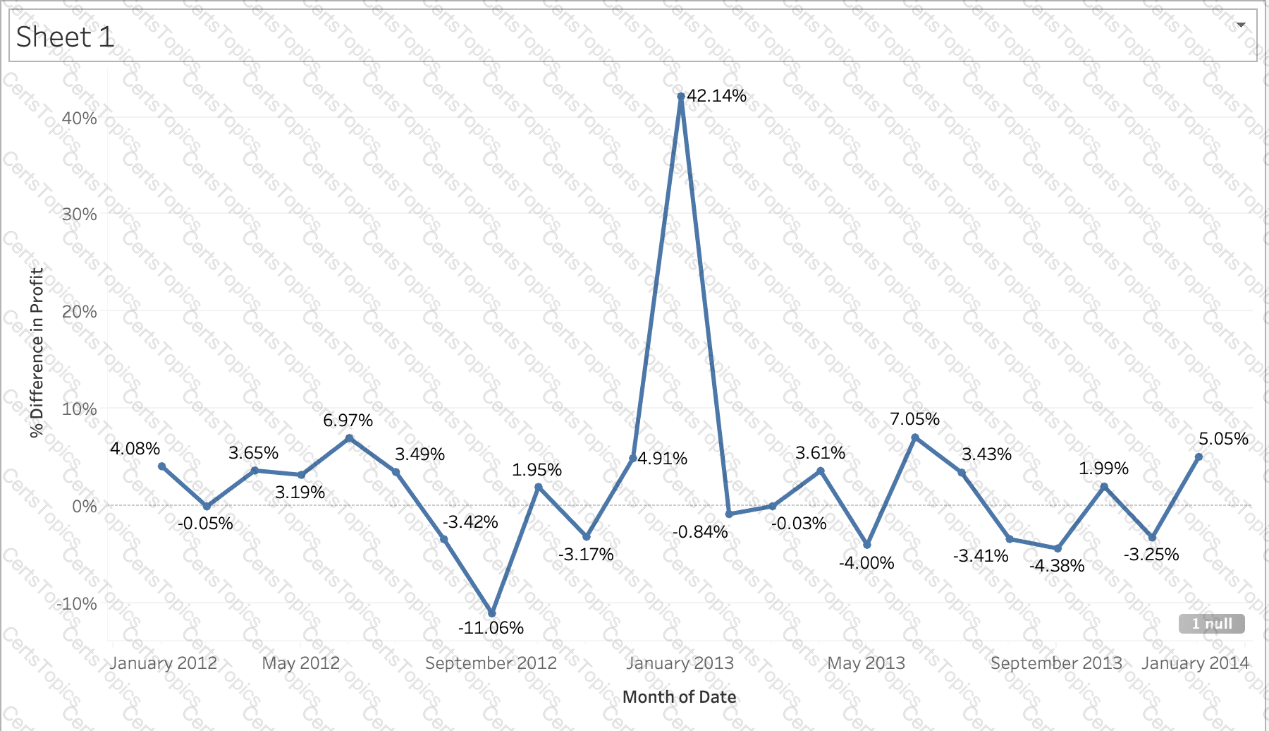
Using the CoffeeChain table, create a chart to see the monthly Percent difference change in Profit, from the beginning of 2012 to the end of 2013. How many months saw a Negative percent difference in Profit?
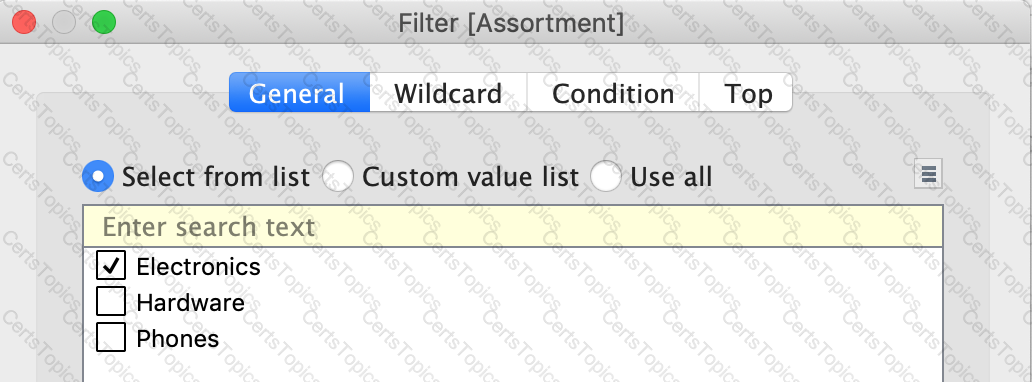
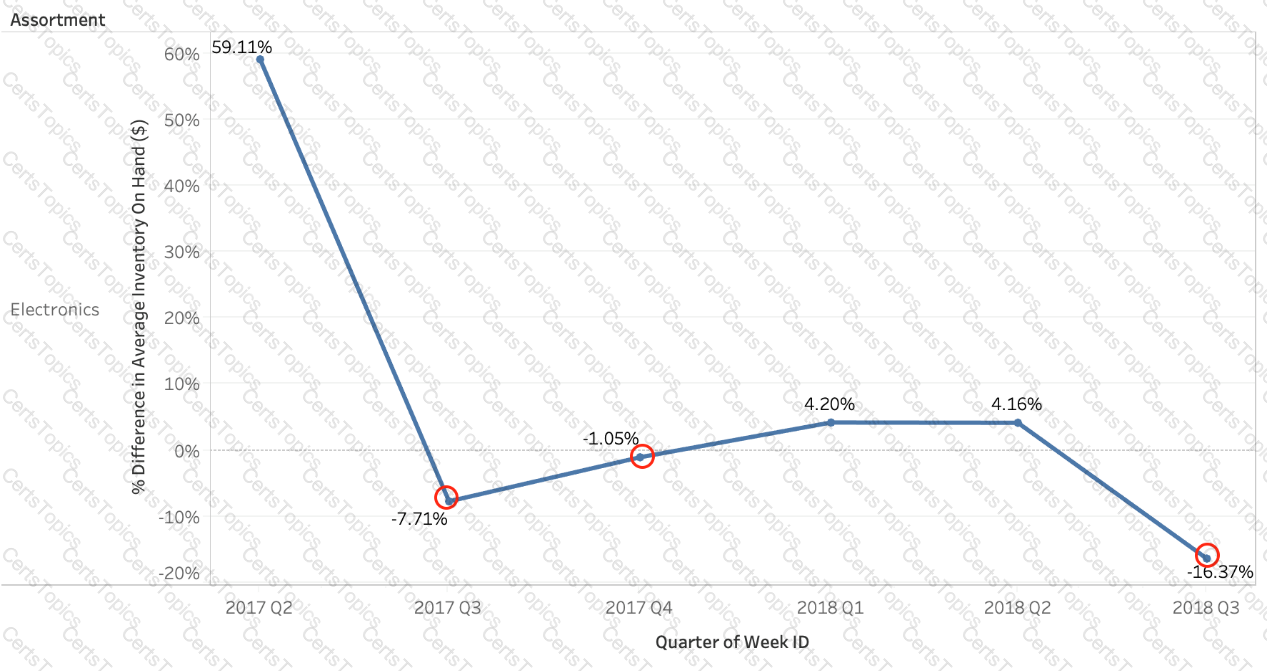
Using the Time Series table, create a chart that shows the percent difference in Average Inventory on Hand for each Assortment by year and quarter.
How many quarters did the Electronics Assortment show a negative percent difference in the Average Inventory On Hand?
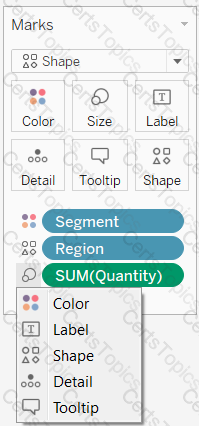
You want to add Custom shapes to your visualisation. Where can you add these new shapes?
Which mark type is used in a highlight table?
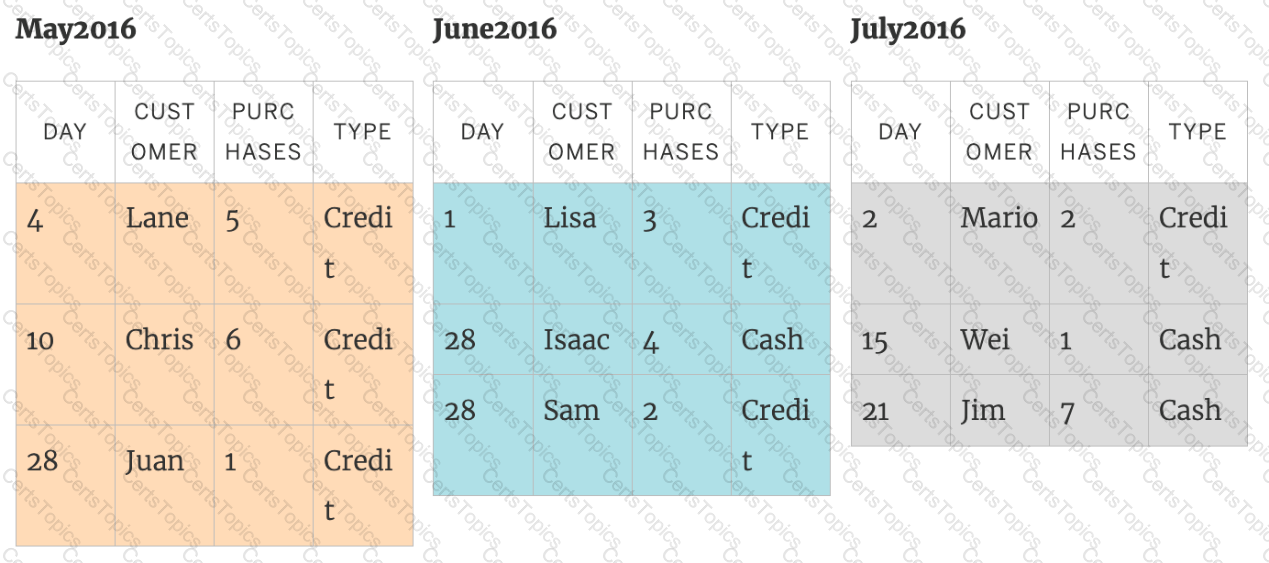
What are two requirements to combine two tables by using a union? Choose two.
In which of the following scenarios would having a live connection be more beneficial than using an extract?
Which of the following shapes does a Heat Map use by default?
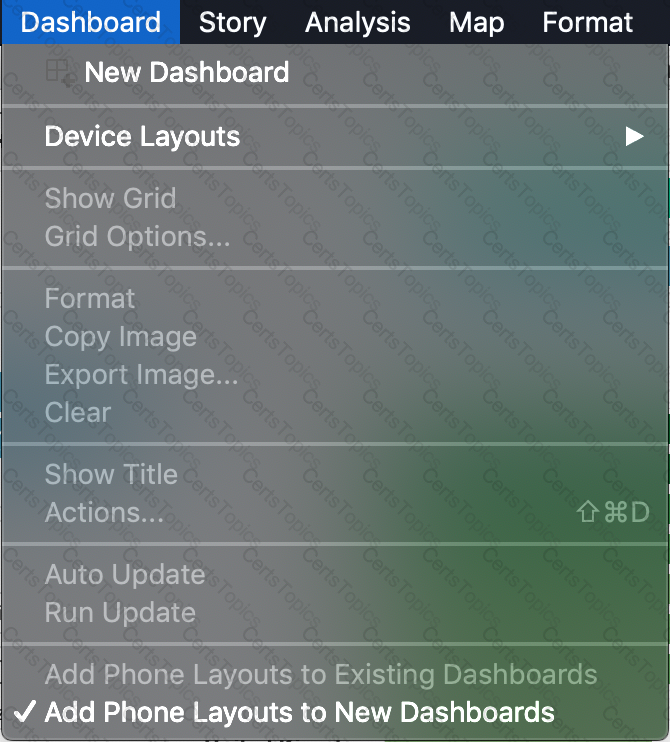
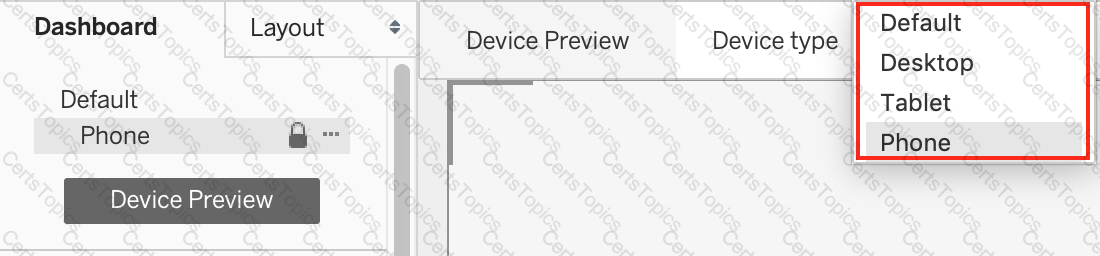
When creating a dashboard for multiple devices, which of the following Device options are available in the Device Preview section?
The Shape option is available for which two views? Choose two.
Which of the following is the correct way to calculate Profit Ratio in Tableau?
A field that shows average home values for the United States in 2016 is most likely :
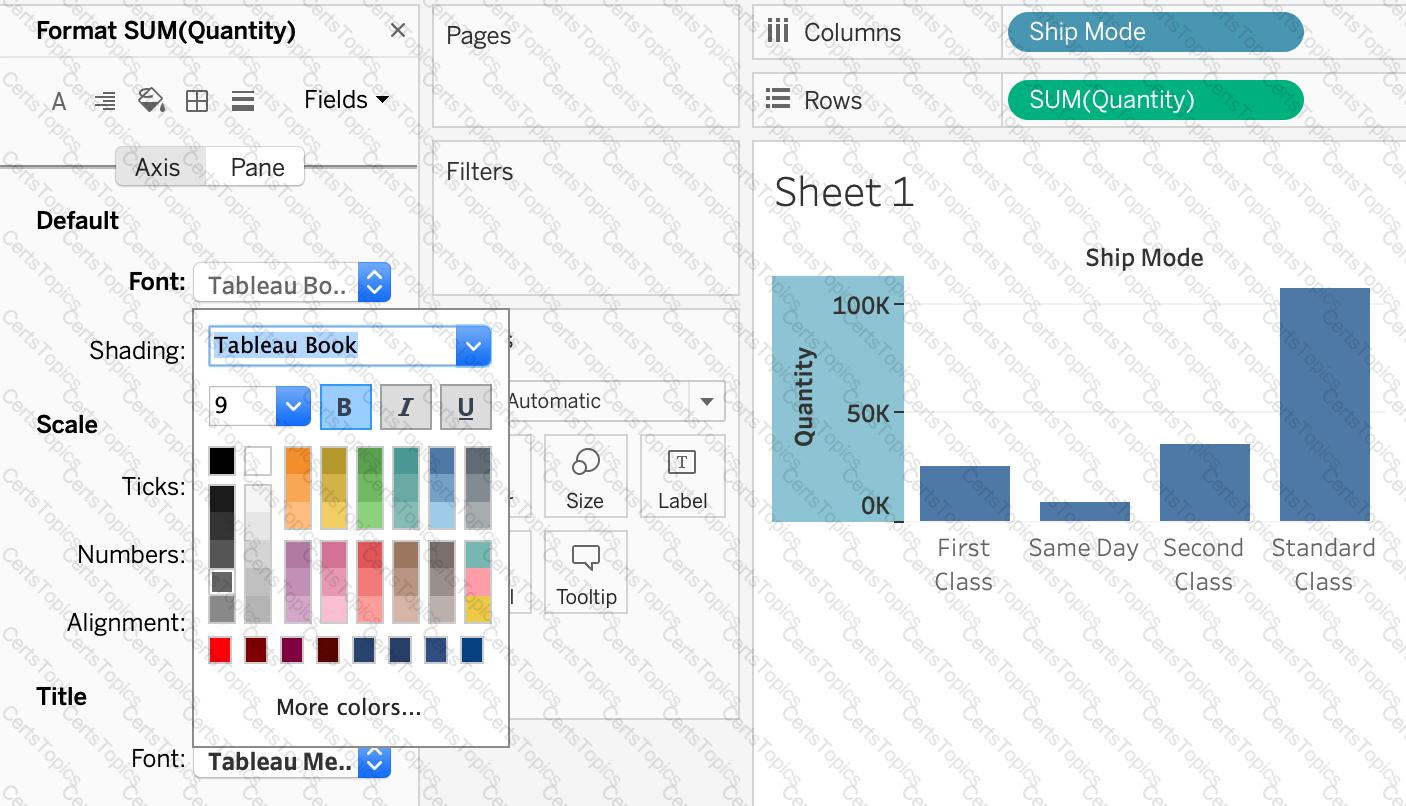
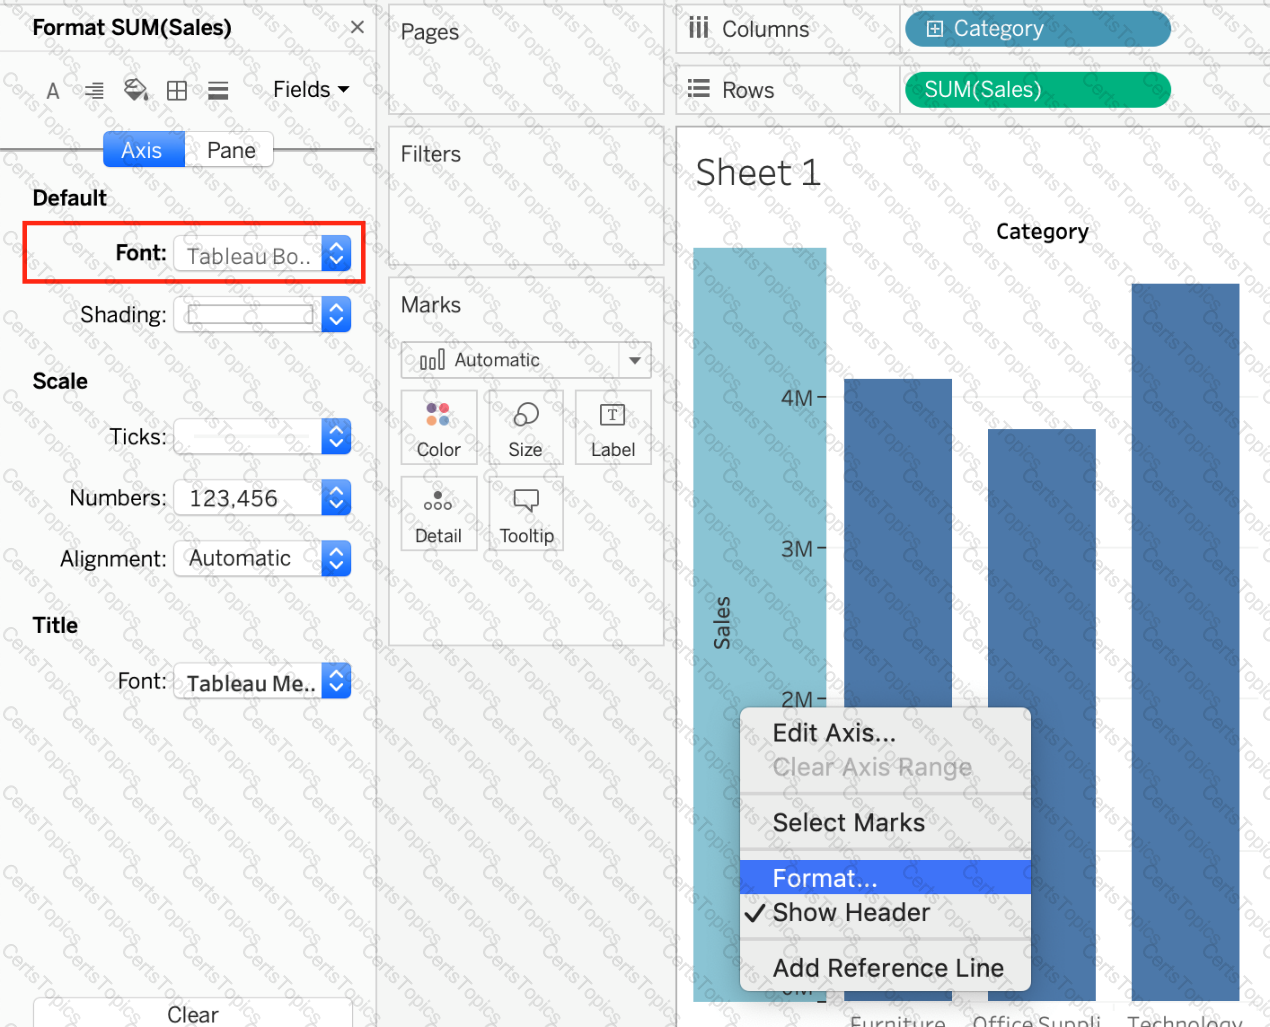
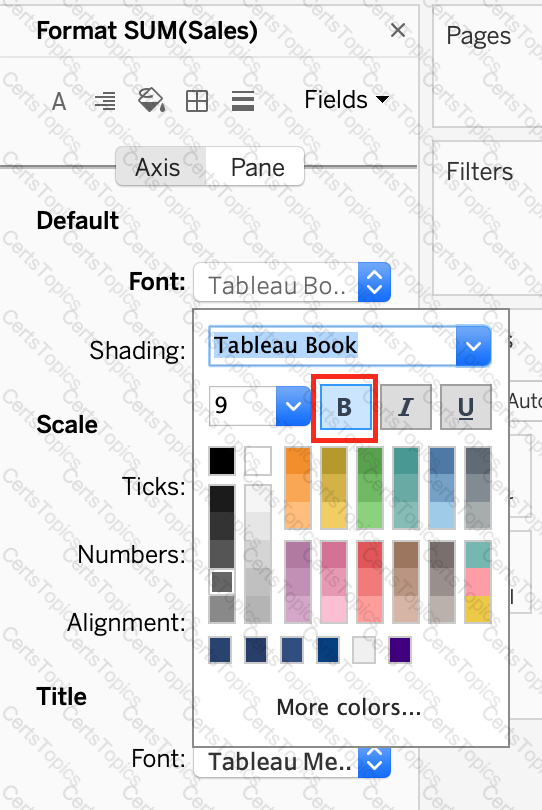
How can you format an axis as Bold in Tableau?
You create a crosstab that shows a list of 100 hotel chains alongside their average nightly cost. You also create two groups showing, respectively, the top 10 and bottom 10 hotel chains by cost, with subtotals.
What should you do to improve the crosstab and compare the two groups to all the remaining hotel chains?
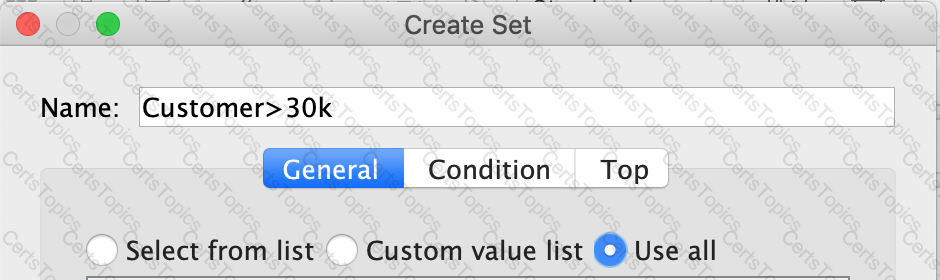
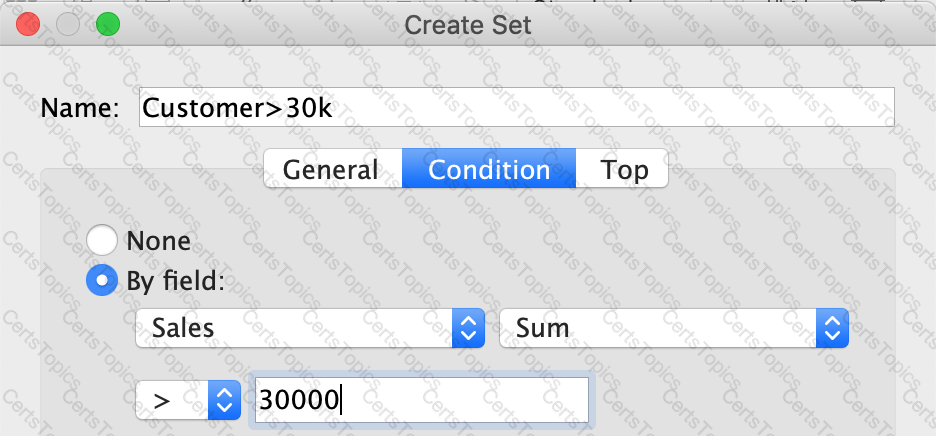
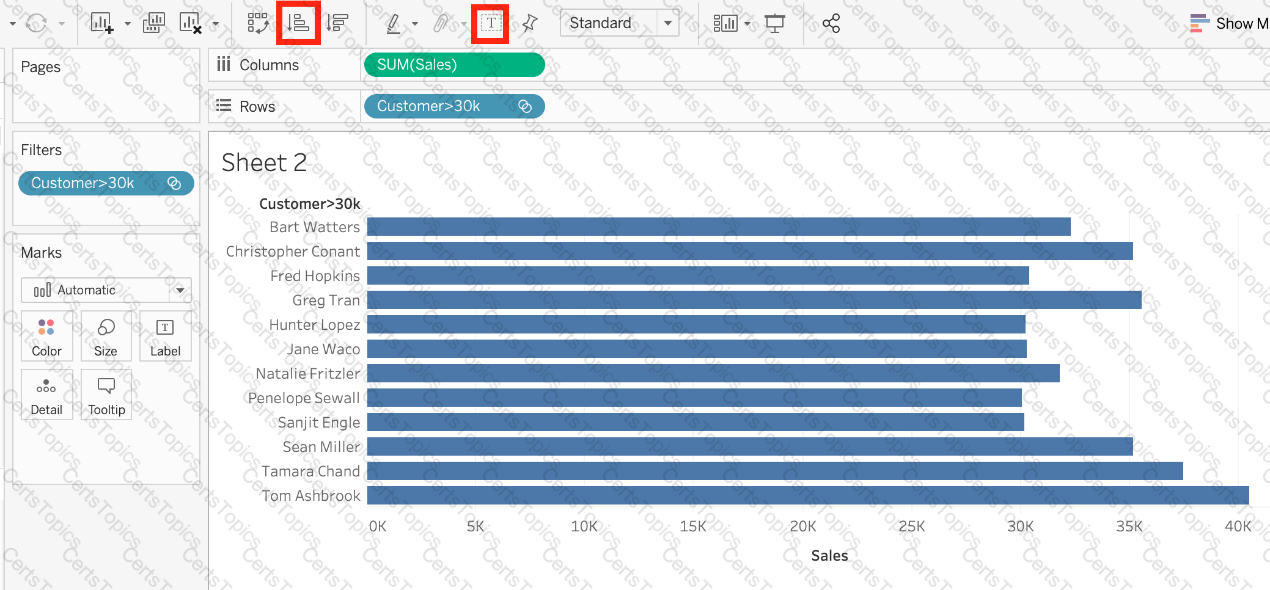
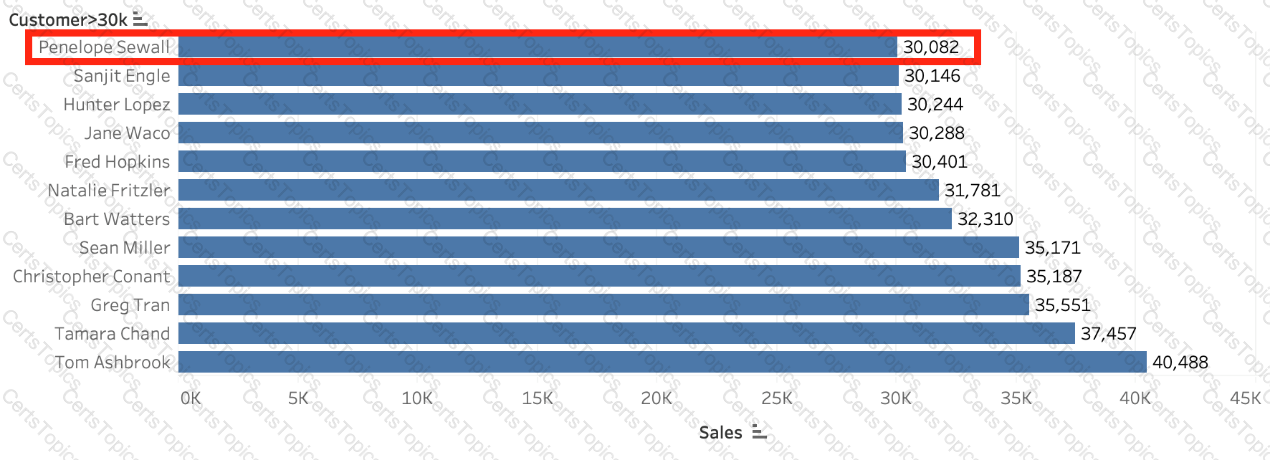
Create a Set containing Customer Names whose Sales are GREATER than 30,000. Which customer had the LEAST sales in this set?
Using the Geo Data table, create a Bar chart showing the In-Stock percentage for each Color. What is the Average In-Stock percentage for the Color Red? Present your answer correctly upto 2 decimal places.
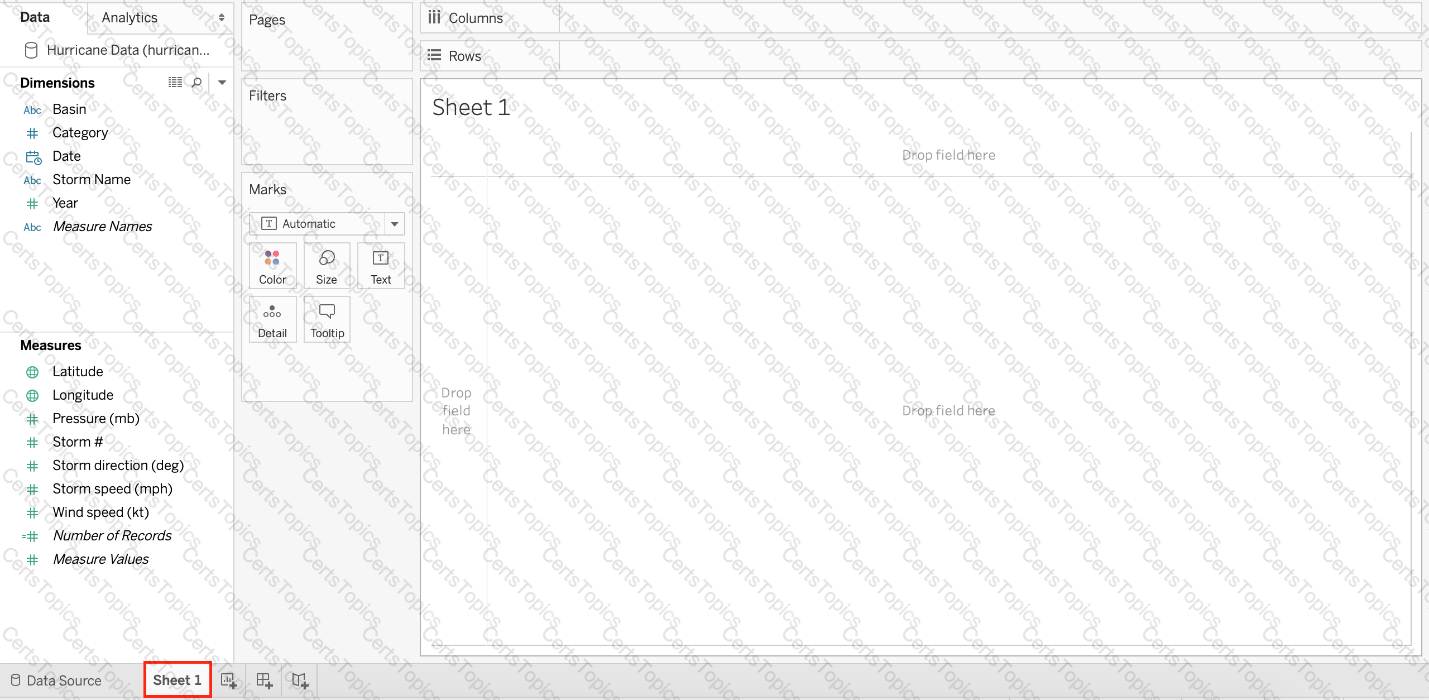
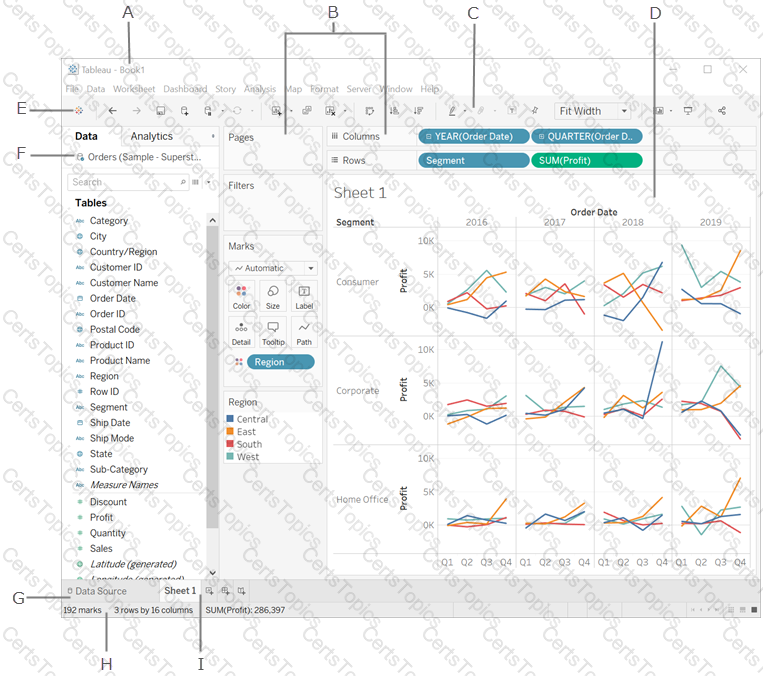
You clicked Sheet 1 from the data source page, and now you have opened the Tableau Desktop workspace as shown above. What is the main thing that you do here?
Larger image
What is this entire view referred to as in Tableau?
Which of the following 2 columns CANNOT be deleted in Tableau?
For which of the following charts, does the Size option on the Marks card not work?
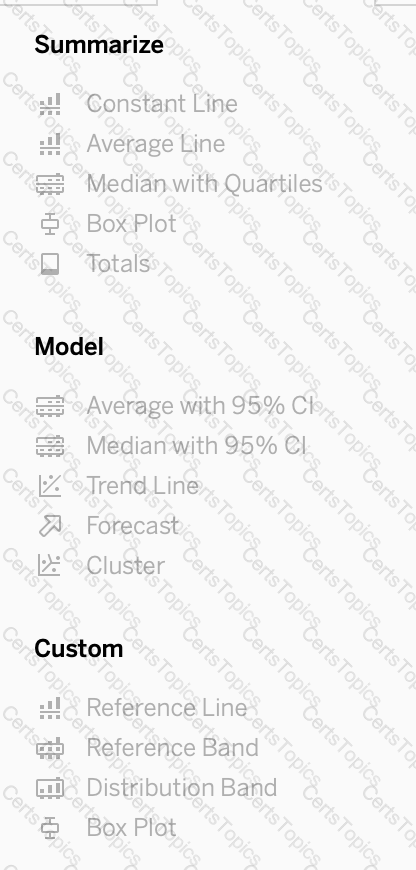
What are three options to change the scope of a reference line? Choose three.
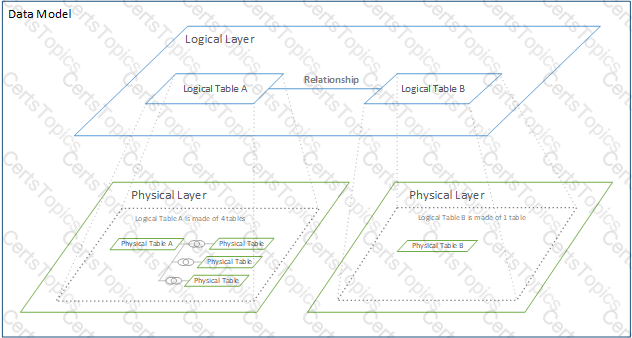
True or False: Physical tables remain distinct (normalized), not merged in the data source whereas logical tables are merged into a single, flat table.
A _____________ action is a hyperlink that points to a web page, file, or other web-based resource outside of Tableau.
Which of the following are interactive elements that can be added to a dashboard for users?
Which of the following situations describe the best reason to use a union?
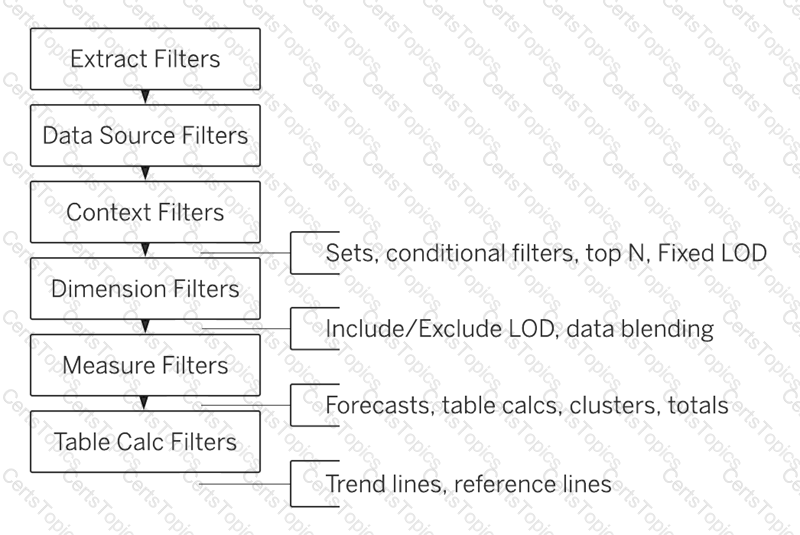
True or False: Context Filters are executed after Data Source filters
Which type of date filter can you use to choose a range of dates based on TODAY ()?
You are creating a combined axis chart.
Where should you drag the second measure after dragging the first measure to the Rows shelf?
You have a workbook that contains one data source and you need to combine data from another database. What should you do first?
Which of the following are benefits of using Data Extracts in Tableau?
Copyright © 2021-2026 CertsTopics. All Rights Reserved


 Graphical user interface, text, application
Description automatically generated
Graphical user interface, text, application
Description automatically generated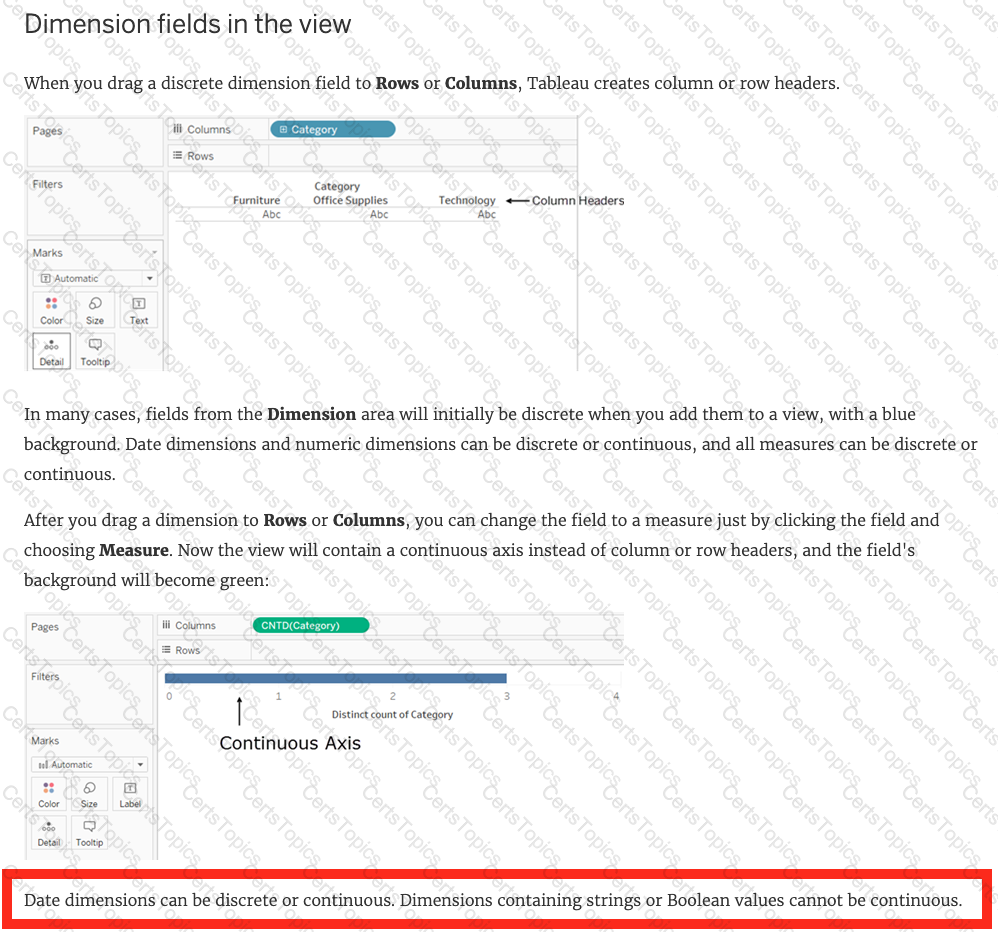


 ( Simple Scatter Plot)
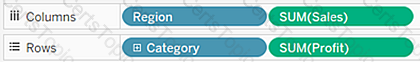 (Matrix of Scatter Plots)
 Graphical user interface, text, application
Description automatically generated
Graphical user interface, text, application
Description automatically generated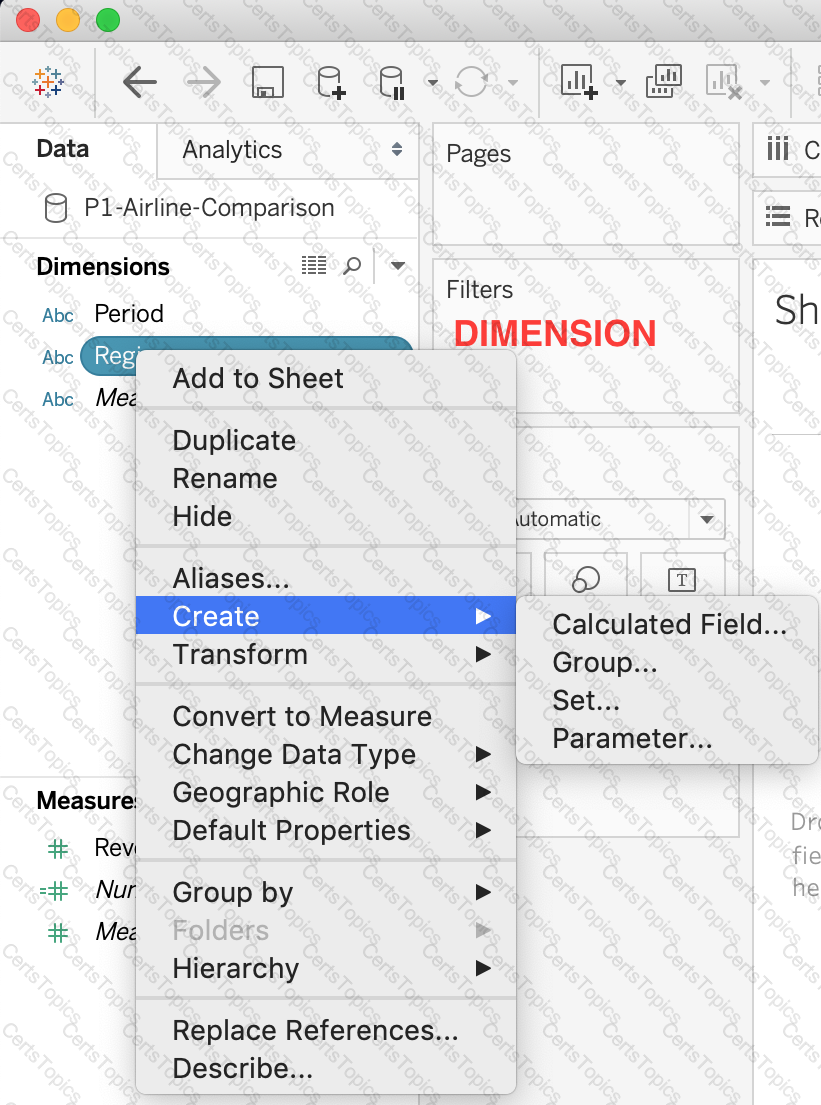
 Chart, line chart
Description automatically generated
Chart, line chart
Description automatically generated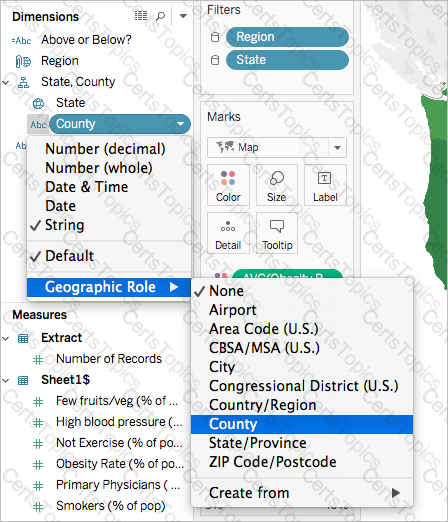
 Diagram
Description automatically generated
Diagram
Description automatically generated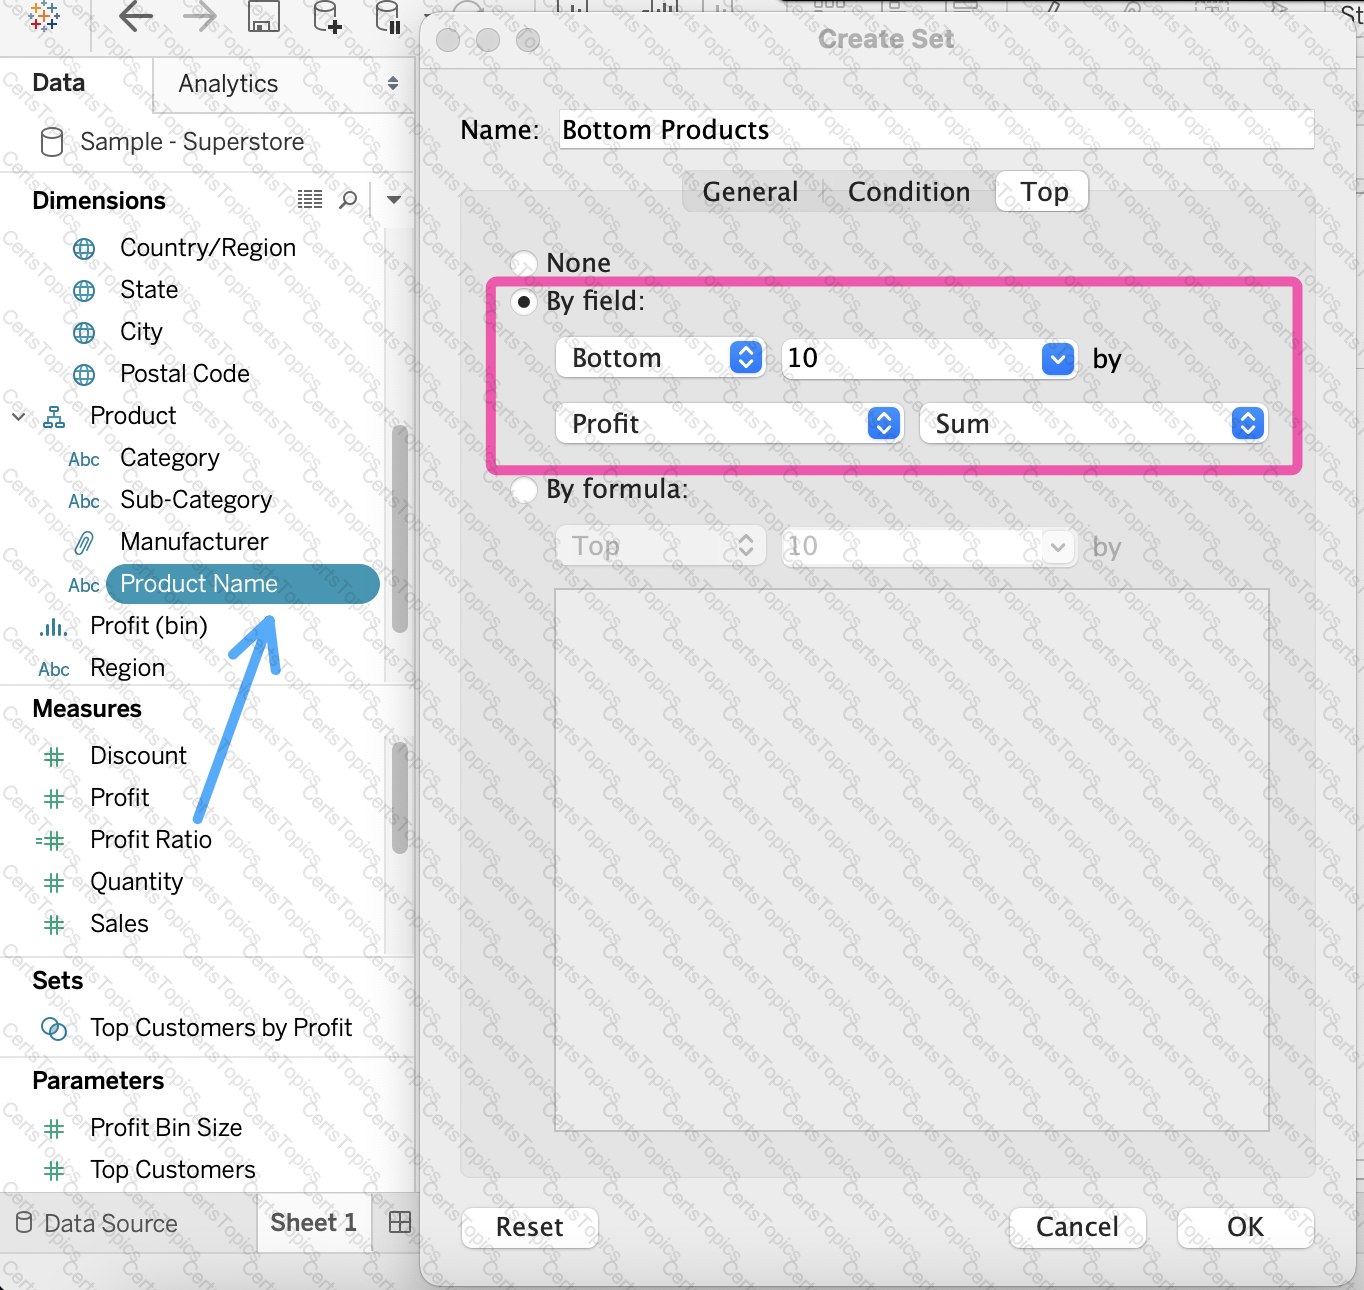

 Graphical user interface
Description automatically generated
Graphical user interface
Description automatically generated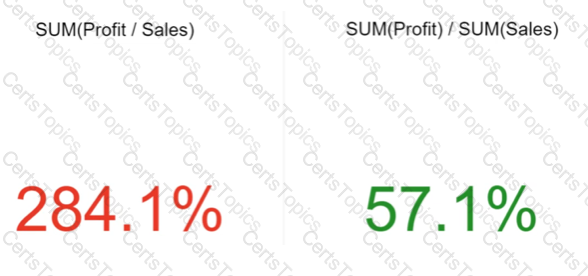

 c
c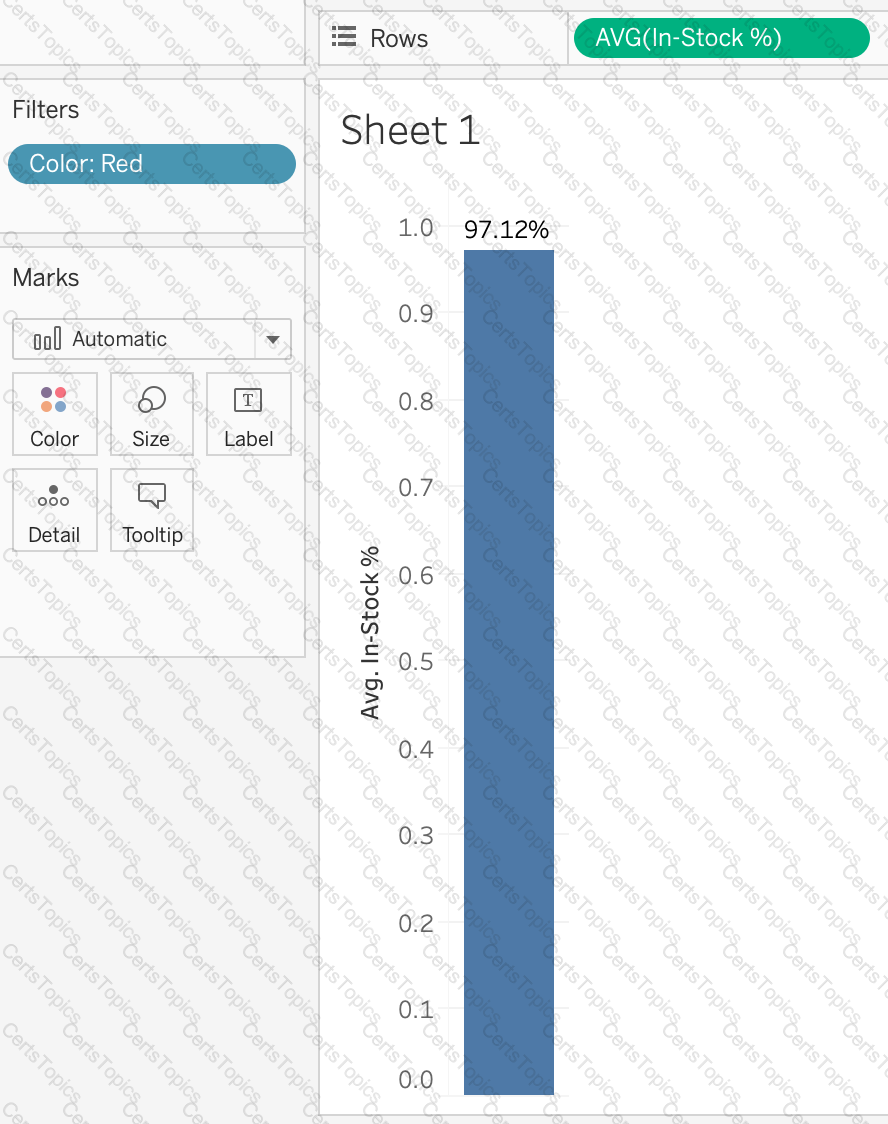
 Graphical user interface, application
Description automatically generated
Graphical user interface, application
Description automatically generated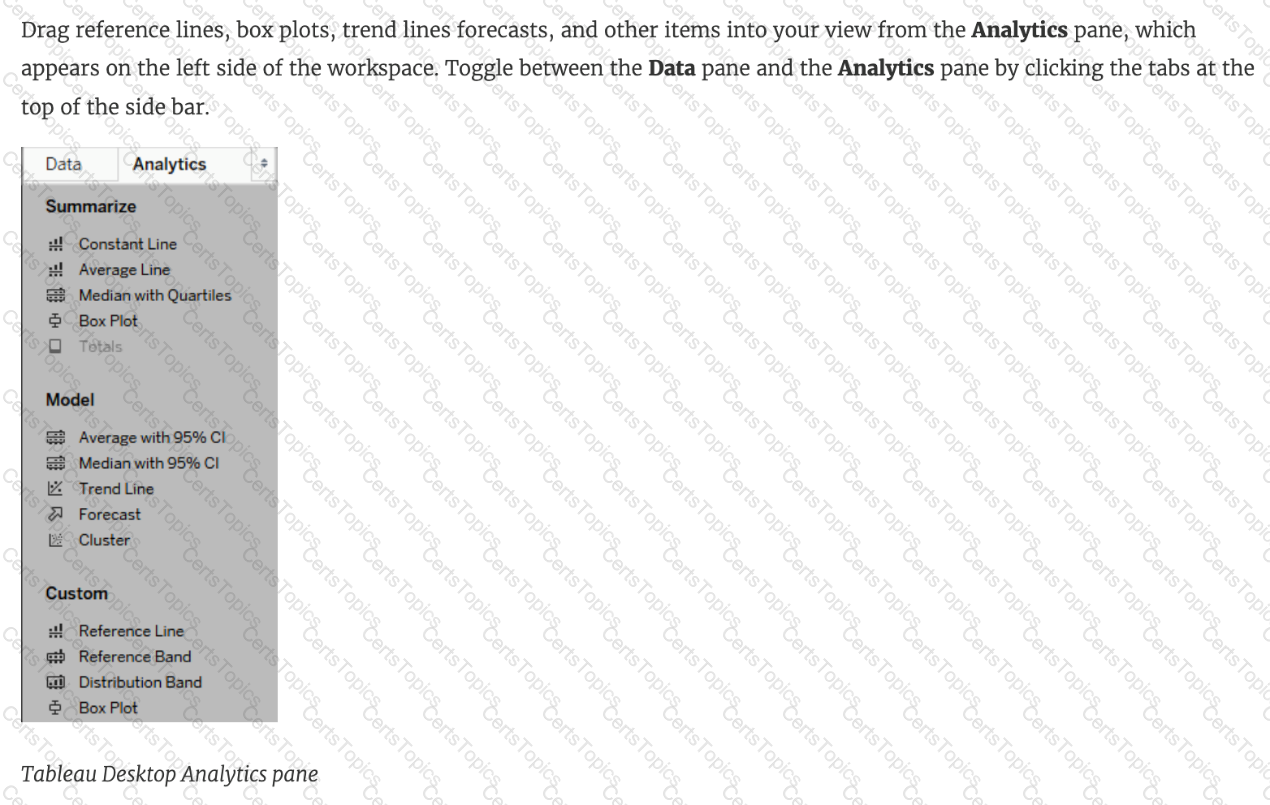
 Graphical user interface, text, application, Word
Description automatically generated
Graphical user interface, text, application, Word
Description automatically generated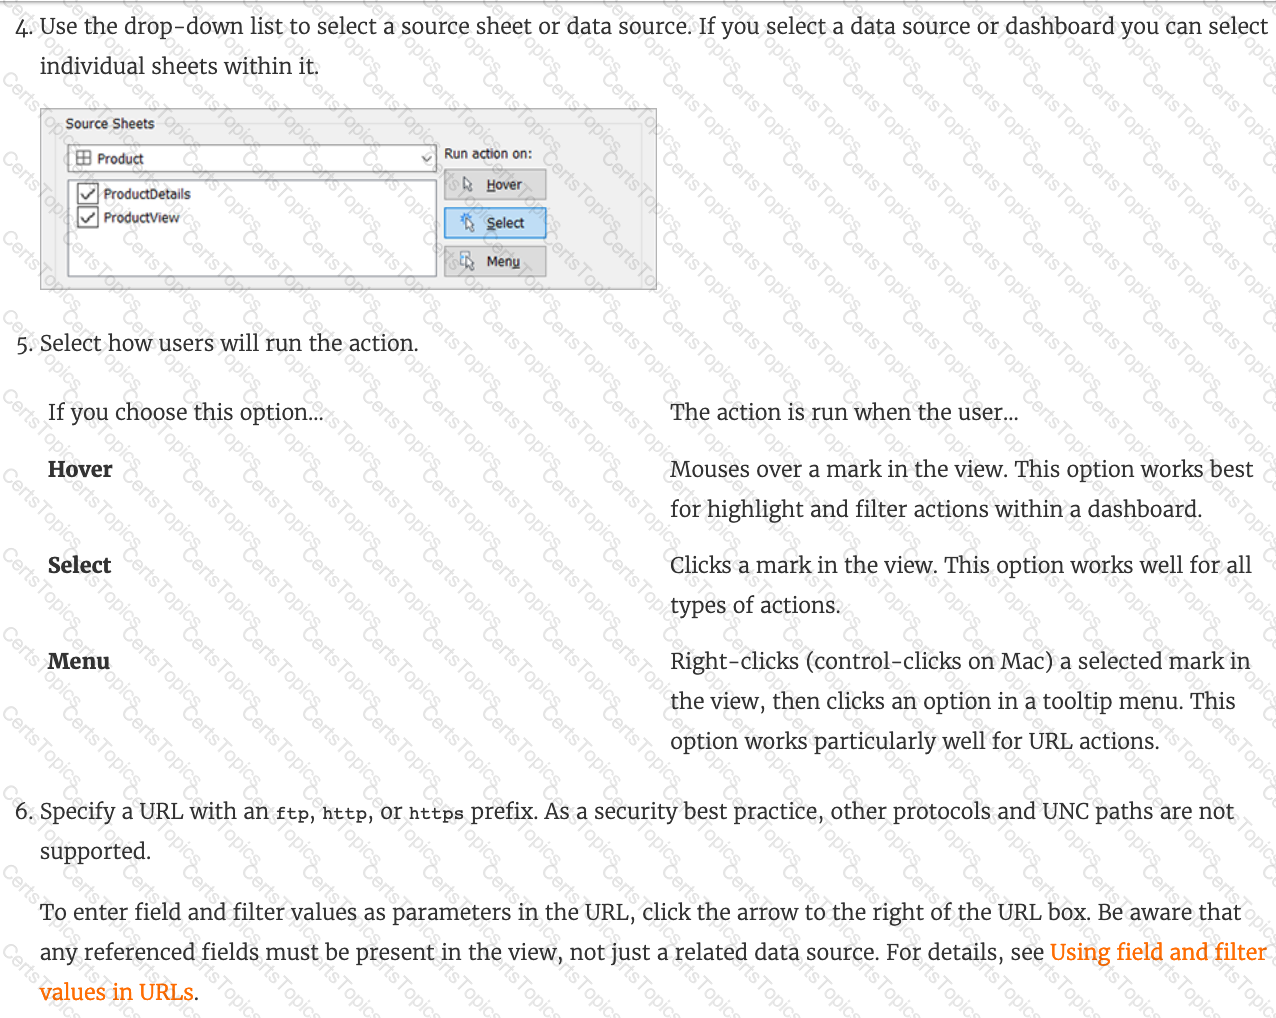 Graphical user interface, text, application, email
Description automatically generated
Graphical user interface, text, application, email
Description automatically generated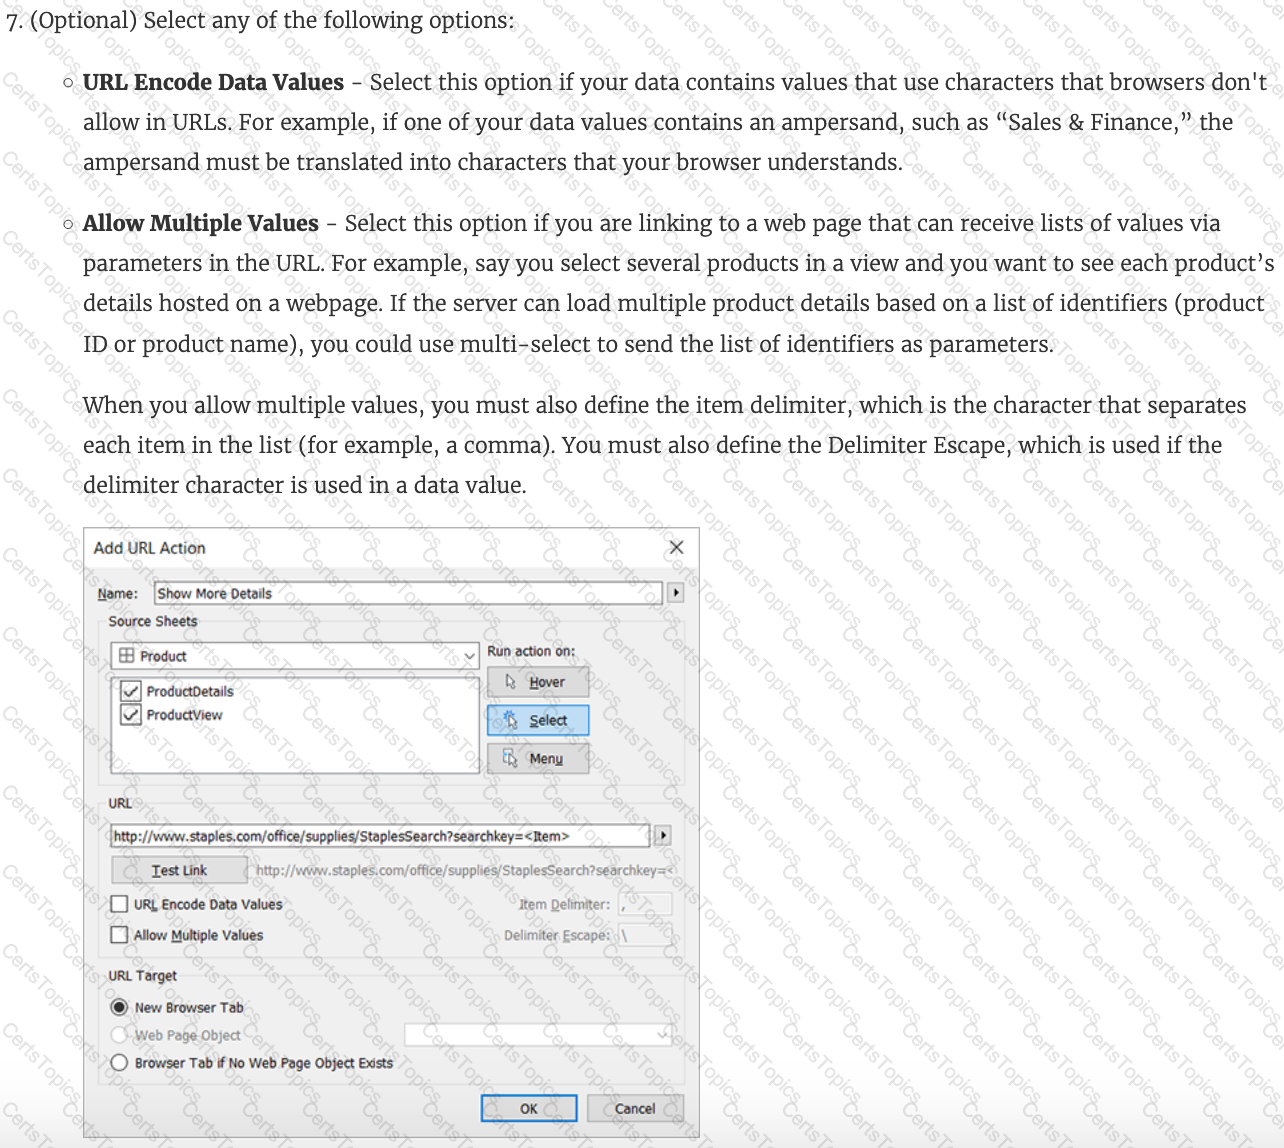 Graphical user interface, text, application, Word
Description automatically generated
Graphical user interface, text, application, Word
Description automatically generated Text, letter
Description automatically generated
Text, letter
Description automatically generated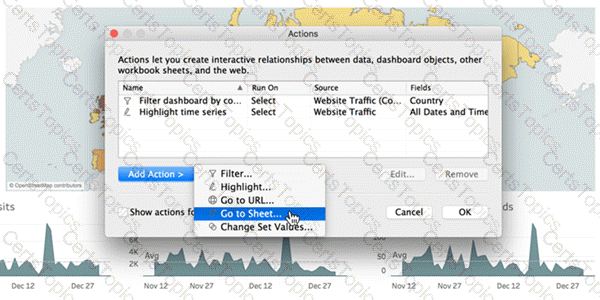 Graphical user interface
Description automatically generated
Graphical user interface
Description automatically generated