A Databricks SQL dashboard has been configured to monitor the total number of records present in a collection of Delta Lake tables using the following query pattern:
SELECT COUNT (*) FROM table -
Which of the following describes how results are generated each time the dashboard is updated?
A user new to Databricks is trying to troubleshoot long execution times for some pipeline logic they are working on. Presently, the user is executing code cell-by-cell, using display() calls to confirm code is producing the logically correct results as new transformations are added to an operation. To get a measure of average time to execute, the user is running each cell multiple times interactively.
Which of the following adjustments will get a more accurate measure of how code is likely to perform in production?
A junior data engineer is working to implement logic for a Lakehouse table named silver_device_recordings. The source data contains 100 unique fields in a highly nested JSON structure.
The silver_device_recordings table will be used downstream to power several production monitoring dashboards and a production model. At present, 45 of the 100 fields are being used in at least one of these applications.
The data engineer is trying to determine the best approach for dealing with schema declaration given the highly-nested structure of the data and the numerous fields.
Which of the following accurately presents information about Delta Lake and Databricks that may impact their decision-making process?
A Delta Lake table was created with the below query:
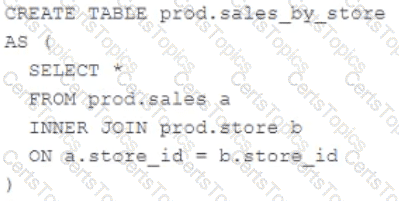
Consider the following query:
DROP TABLE prod.sales_by_store -
If this statement is executed by a workspace admin, which result will occur?
Copyright © 2021-2026 CertsTopics. All Rights Reserved
