As part of your analysis, you discover that an incident is a false positive.
You change the incident status to Closed: False Positive.
Which statement about your update is true?
(How does FortiAnalyzer block indicators? (Choose one answer)
You must find a specific security event log in the FortiAnalyzer logs displayed in FortiView, but, so far, you have been unsuccessful.
Which two tasks should you perform to investigate why you are having this issue? (Choose two.)
You discover that a few reports are taking a long time to generate. Which two steps can you take to troubleshoot? (Choose two.)
What happens when the indicator of compromise (IOC) engine on FortiAnalyzer finds web logs that match blacklisted IP addresses?
After generating a report, you notice the information you were expecting to see is not included in it. However, you confirm that the logs are there:
Which two actions should you perform? (Choose two.)
You need to move reports between two ADOMs.
Which two statements are true? (Choose two.)
Exhibit.
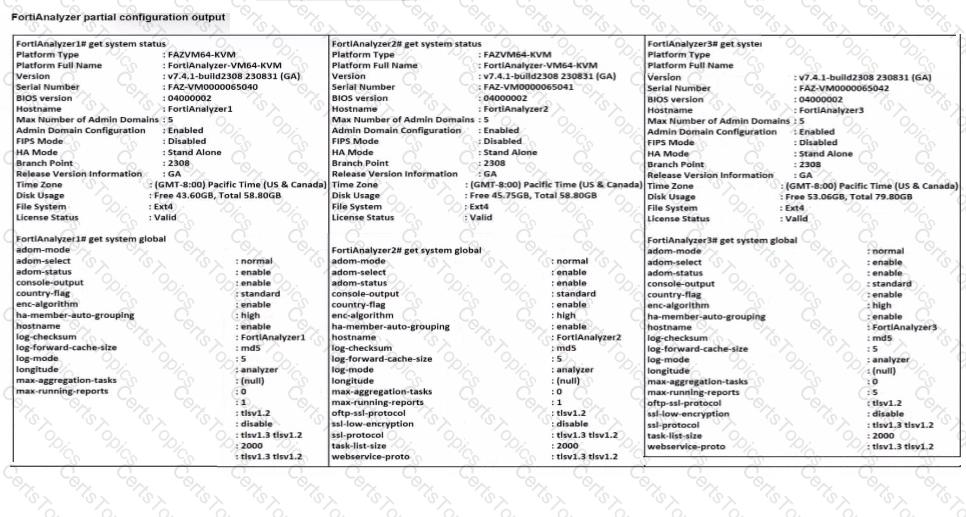
Based on the partial outputs displayed, which devices can be members of a FortiAnalyzer Fabric?
(Refer to the exhibit.
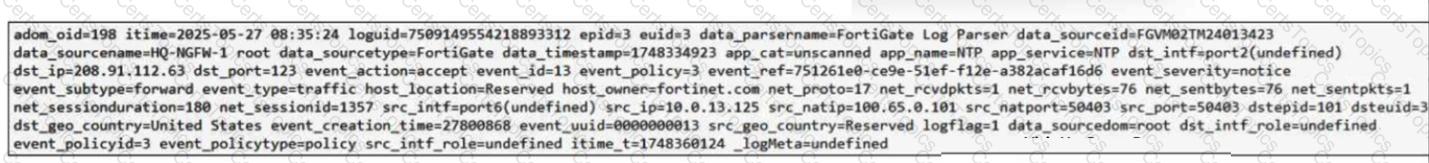
Which two observations can you make after reviewing this log entry? (Choose two answers)
Exhibit.
What does the data point at 12:20 indicate?
Which statement about sending notifications with incident updates is true?
What is the purpose of using data selectors when configuring event handlers?
(Which two parameters does FortiAnalyzer use to identify an indicator of compromise (IOC)? (Choose two answers)
Which statement about SQL SELECT queries is true?
You are trying to configure a task in the playbook editor to run a report.
However, when you try to select the desired playbook, you do to see it listed.
What is the reason?
Which two statements regarding FortiAnalyzer operating modes are true? (Choose two.)
(You created a playbook on FortiAnalyzer that uses a FortiOS connector. When you configure FortiGate, which type of trigger must you use so that the actions in an automation stitch are available in the FortiOS connector? (Choose one answer)
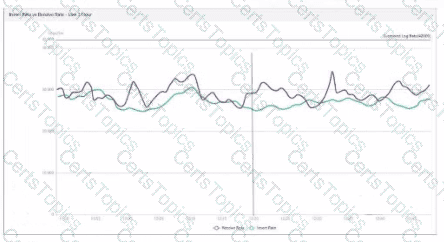
Exhibit.
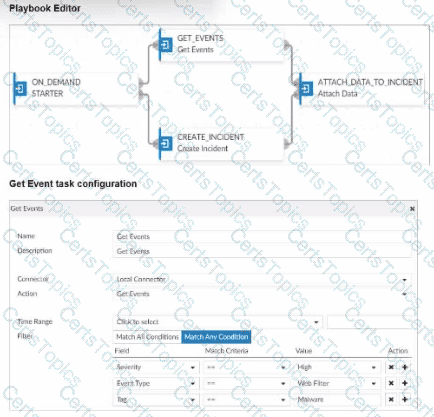
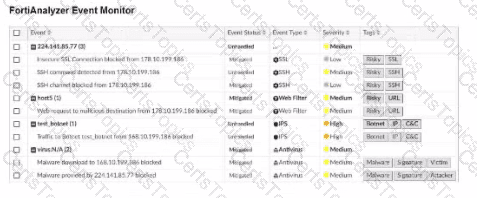
Assume these are all the events that exist on the FortiAnalyzer device.
How many events will be added to the incident created after running this playbook?
Which two statements about local logs on FortiAnalyzer are true? (Choose two.)
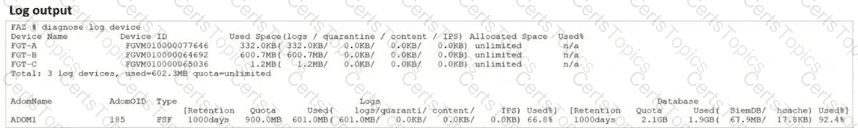
Exhibit.

What can you conclude about the output?
Refer to the exhibit.
What can you conclude from this output? (Choose one answer)
Refer to the exhibit.
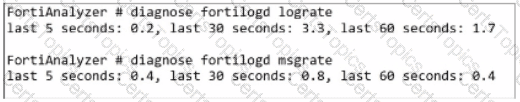
What can you conclude about the output?
Which statement about the FortiSOAR management extension is correct?
Copyright © 2021-2026 CertsTopics. All Rights Reserved
