
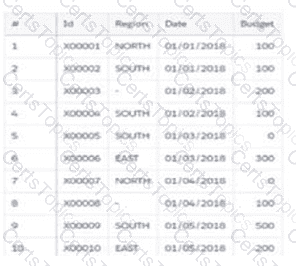
Universal Containers (UC) creates a dataset, "Book11", containing a budget per region per month for the first 6 months of the year, as shown in the graphic below. Now, UC wants to create a lens showing
the total budget for each region for each month. Every combination of region and month must be shown in the lens, even if there is no data.
How should a CRM Analytics consultant help UC build this lens?
ACRM Analytics consultant is reviewing results from an Einstein Discovery story with a business user. They agree with the findings but notice that none of the fields used in the story have a correlation value greater than 4%. The client is now concerned that the model
may not be good enough to deploy.
Which action should the consultant take?
CRM Analytics team plans to enable data sync.
Which limit specific to data syne should the team consider before enabling the feature because it may impact existing jobs?
A CRM Analytics consultant wants to move a dataflow to a recipe in order to use aggregation nodes. To do so, they use the Dataflow to Recipe convertor and the recipe runs successfully.
However, they are unable to see the aggregated data in the dataset.
What is causing the issue?
Cloud Kicks (CK) wants to use CRM Analytics to analyze trends of its sales pipeline in order to accelerate the company's sales process. To do so, CK needs to know the average time an opportunity
spends in each stage. The data can be found in the Opportunity History object, but the value is not pre-calculated in Salesforce, so a consultant recommends using a recipe to calculate it.
How should the consultant use a recipe to calculate the average time an opportunity spends in each stage?
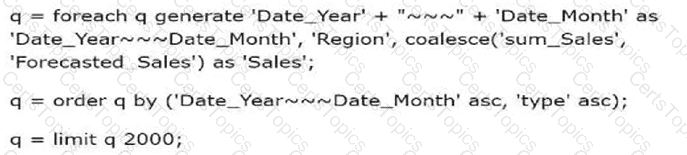
Which timeseries statement will fix the query?
A client has two datasets that are used across seven different dashboards. Three of these dashboards are used by marketing and four are used by sales. The client requires that only marketing can
access the marketing dashboards and only sales can access the sales dashboards.
Which solution should a consultant recommend?
Universal Containers has a dashboard for sales managers. They need to visualize the percentage of their opportunities in the pipeline in a Gauge chart. They want to customize the chart to keep track if they are below or beyond the target.
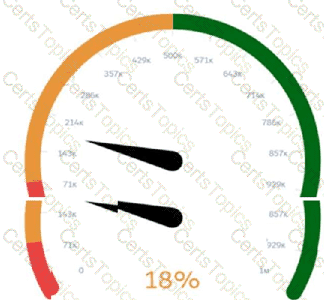
Which widget parameters should a consultant use?
A CRM Analytics consultant is asked to help a company report on its sales activity. The company wants to train some users to create dashboards. The company also wants one other specific team to be able to use the dashboards.
What should the consultant do to address these requirements?
A CRM Analytics consultant at Cloud Kicks wants to create a new dashboard that uses custom GeoJSON to display data; however, they are unable to upload the file via the user interface (UI).
Which action should the consultant take?
At Universal Containers, a dashboard is built to track sales metrics. The Opportunity amount field has conditional formatting added — it turns green for closed won and red for closed lost.
How should a CRM Analytics consultant enhance the dashboard design to become more accessible to users with color vision challenges?
The CRM Analytics consultant at Universal Containers has set data syncs and recipe runs back to back. However, they notice that the data syncs and recipe run jobs fail repeatedly. Upon investigation,
they realize the data syncs and recipes are tightly coupled which leads to too many runs being queued and eventually being canceled.
How should the consultant resolve this issue?
Cloud Kicks (CK) has a dashboard in CRM Analytics with forecasting data. One widget is a compare table using the timeseries function showing the quarterly forecast. However, CK is interested in enhancing the dashboard with a weekly forecast per customer.
How should CK achieve this?
A CRM Analytics consultant has been asked to bring data from an external database as well as five external Salesforce environments into CRMAnalytics. Twenty-five objects have been enabled from the local Salesforce connector.
The requirements are:
* 10 objects should be enabled from an external database
* 12 objects each from three of the external Salesforce environments
* 15 objects each from the remaining two external Salesforce environments
The consultant estimates each connector will, per object, bring between 1,000 and 1 million rows of data.
Which limit will be exceeded?
After the initial creation of a model, the first model insight explains
93% of the variation of the outcome variable. This is unusually high.
What is the most likely reason for this?
Universal Containers has a dashboard for sales managers. They need the ability to visualize the number of Closed Won opportunities by month, quarter, or year, and then display the result in a single chart. A CRM Analytics consultant creates a custom query to display three values:
ClosedDate_month, ClosedDate_ quarter, and ClosedDate_year.
What should the consultant do next?
The CRM Analytics project team at Universal Containers is creating an app with dashboards, datasets, and lenses. The app has been shared with multiple users with Viewer, Editor, and/or Manager
access.
One end user is unable to view the dashboard watchlist that was previously set up. They are receiving a “Resource not found” error while trying to access the dashboard. The team confirms that the end
user has Viewer access to the app but the project team is able to view the dashboard.
What is the reason for this error?
A CRM Analytics consultant is asked to make changes to the current sales dashboard at Cloud Kicks. The dashboard is crucial to track the daily sales performance of the company and needs to be
available for other users while the consultant works on the changes.
How should the consultant proceed to update the dashboard?
Cloud Kicks uses CRM Analytics for its sales reporting. A new manager needs access to CRM Analytics to see specific dashboards.
How should the system administrator give access to the Analytics
Studio app in the App Launcher?
A CRM Analytics consultant is working on Sales dashboards with multiple datasets and advanced queries in the Sales Analytics app.
Sales managers in the organization have been given Editor/Manager access to the app, whereas sales reps have been given Viewer access.
Some dashboards that are in progress are not ready to be rolled out to sales reps and should only be viewable by sales managers.
How should the consultant accomplish this?
Cloud Kicks has a dashboard that displays accounts and opportunities data in a table that contains actions to open the records in Salesforce. Since the company has allowed several accounts to be
created with the same names, when users try to perform actions, they are prompted with only a record ID to select, leaving the users confused and unable to act.
How should the CRM Analytics consultant solve this problem?
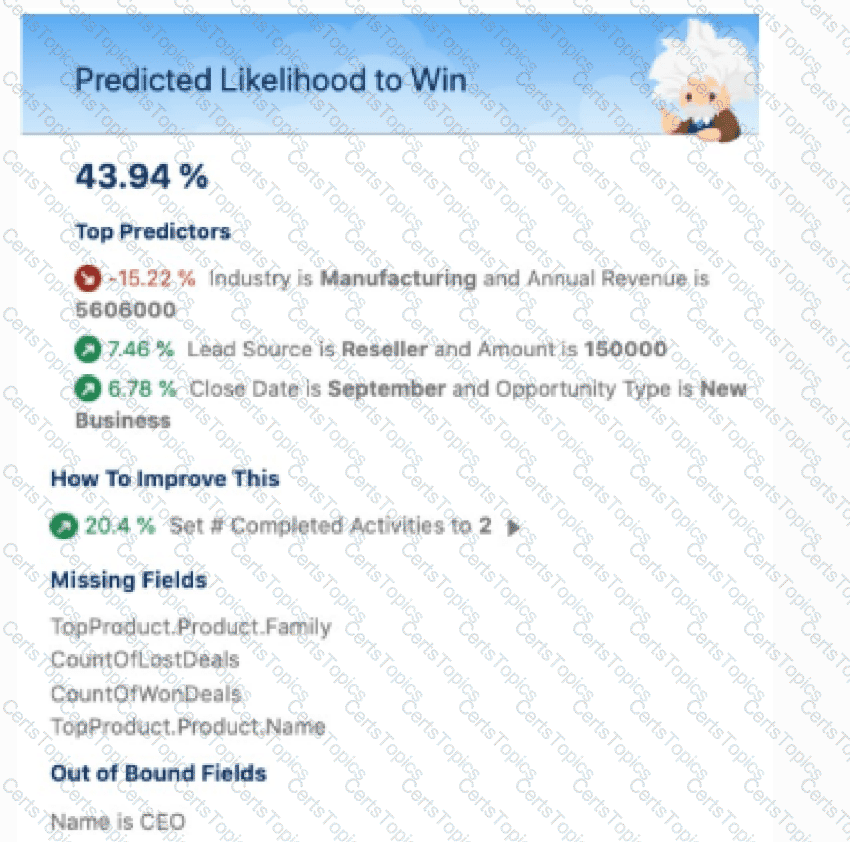
For a story created using multiple data sources (Salesforce, CSV, and external data), what is a possible fix for the issue shown in the prediction?
Which statement best describes how to ensure CRM Analytics dashboards are easily used across both desktop and mobile devices?
AW Computing will start using Tableau Online to report on some of its Salesforce data to users who do NOT have an SFDC license.
What is the first step the CRM Analytics consultant should take?
Universal Containers (UC) has a "Sales Manager” dashboard. UC has a compare table that has multiple groupings and columns added showing the Total and Subtotals of the numeric values. A consultant is
asked to add additional groups to enhance details about UC's customers.
Which feature should the consultant use to make the navigation of the compare tables easier for the end user?
A CRM Analytics consultant at Cloud Kicks is trying to upload data using an External Data API and the CSV file with the data wasuploaded successfully. Upon analyzing the data using a lens, they find
they are unable to perform any mathematical operations as all the data and fields are treated as dimensions.
What is causing the problem?
A team of CRM Analytics developers has been working on an existing recipe to add new derived fields. The edited version has been failing ever since, and management is requesting that the dashboard show refreshed data while they work on the edits.
How can the developers add new fields while keeping the dataset refreshed?
Universal Containers intends to use a custom Salesforce big object in its org and visualize the data using CRM Analytics. As the number of rows to be synced is quite large, the CRM Analytics consultant is looking to set up an incremental sync with additional filters added as part of the data sync to improve performance.
What should the consultant keep in mind while implementing this?
A company realizes it has a lot of rich information around its cases, but unfortunately, most of this isunstructured/textual data. Thecompany is exploring how to include some of this information in its case prioritization.
Which option within CRM Analytics should a consultant leverage?
Cloud Kicks has informed CRM Analytics developers that they have two scenarios with restricted row-level security.
The parameters being:
1. Non-CXOs and VPs working in EMEA can have access to EMEA records only.
2. CXOs and VPs should have access to all data irrespective of the region (APAC, EMEA, etc.).
Which sharing method works for this scenario?
A project team member uploads a CSV file to CRM Analytics, and they notice a few records failed during the upload. The manager wants to view the error log generated so this can be fixed and uploaded again. The manager has the CRM Analytics administrator permissionbut is unable to download the error log details.
Why is the manager unable to download the log details?
A CRM Analytics administrator is working on deploying a dataflow and a dataset (generated by this dataflow) to another org.
While creating a change set, they notice that the components are NOT visible to be included in the change set.
What is the reason for this?
A CRM Analytics consultant has prepared a CSV file to be uploaded to CRM Analytics. By mistake, one of the column headers is modified as random non-alphanumeric characters "* & **( & *(%", which went unnoticed prior to uploading the file.
What is the expected behavior of the uploaded CSV column?
A system administrator at Cloud Kicks creates a joined report to showcase the new business deals closing in the current quarter, which was well received by the business stakeholders. A manager wants to visualize this report on CRM Analytics.
The CRM Analytics consultant determines the report can be trended on CRM Analytics, but it's not working as expected.
What is causing the issue?
Copyright © 2021-2026 CertsTopics. All Rights Reserved
