
Weekend Sale Special - 75% Discount Offer - Ends in 0d 00h 00m 00s - Coupon code: big75certs

Pass Analytics-Con-201 Exam Guide

Salesforce Certified CRM Analytics and Einstein Discovery Consultant Questions and Answers

Question 5

Cloud Kicks (CK) wants to use CRM Analytics to analyze trends of its sales pipeline in order to accelerate the company's sales process. To do so, CK needs to know the average time an opportunity

spends in each stage. The data can be found in the Opportunity History object, but the value is not pre-calculated in Salesforce, so a consultant recommends using a recipe to calculate it.

How should the consultant use a recipe to calculate the average time an opportunity spends in each stage?
Options:

A.

An aggregate transformation with offset parameter to calculate the duration

B.

Flatten transformation with offset expressions to calculate the duration

C.

Custom transformation with a multiple row formula to calculate the duration

Question 6

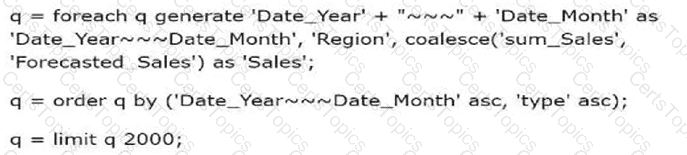
Which timeseries statement will fix the query?

Options:

A.

q= timeseries q generate 'sum_Sales' as ‘Forecasted_Sales' with (dateCols=(‘Date_Year’, ‘Date Quarter’, "Y-Q"), partition='Region', seasonality=4);

B.

q = timeserles q generate 'sum_Sales’ as 'Forecasted_Sales’ with (length=12,dateCols=("Date_Year', ‘Date_Month', "Y-M"), partition='Region');

C.

q = timeseries q generate 'sum_Sales' as 'Forecasted_Sales' with (dateCols=(‘Date_Quarter’, 'Date_Month’, "Q-M"), partition='Region’, ignoreLast=true);

Question 7

A client has two datasets that are used across seven different dashboards. Three of these dashboards are used by marketing and four are used by sales. The client requires that only marketing can

access the marketing dashboards and only sales can access the sales dashboards.

Which solution should a consultant recommend?

Options:

A.

Create three custom apps: one for marketing dashboards with marketing as "viewer", one for sales dashboards with sales as "viewer", and one for datasets where marketing and sales are "viewer".

B.

Duplicate the datasets and create two custom apps: one for marketing dashboards and datasets with marketing as “editor” and one for sales dashboards and datasets with sales as "editor".

C.

Use two custom apps: one for marketing dashboards with marketing as "viewer" and one for sales dashboards with sales as “viewer". Add the datasets as references to both custom apps.

Question 8

Universal Containers has a dashboard for sales managers. They need to visualize the percentage of their opportunities in the pipeline in a Gauge chart. They want to customize the chart to keep track if they are below or beyond the target.
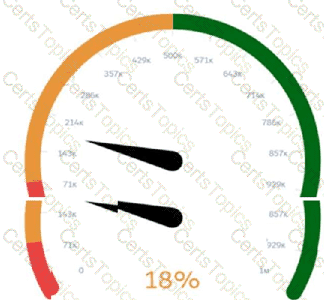
Which widget parameters should a consultant use?

Options:

A.

Range Values, Angle, Conditional Formatting

B.

Reference Line, Angle, Range Values

C.

Reference Line, Markers, Conditional Formatting
