You have a database that includes field named sales, City and Region.
You have the following chart that shows the number of sales made in different cities.
You want to dynamically show the corresponding region when users hover their mouse over any of the bars.
What should you do?
You have the following dataset.
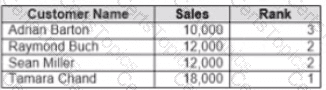
Yon need to calculate the ranking shown in the Rank field.
How should you complete the formula? (Use the dropdowns in the Answer Area to select the correct options to complete the formula ?

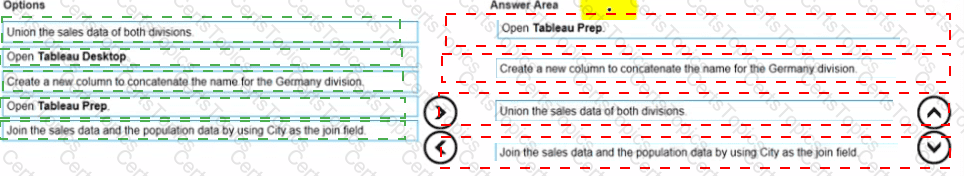
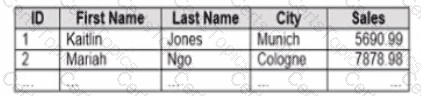
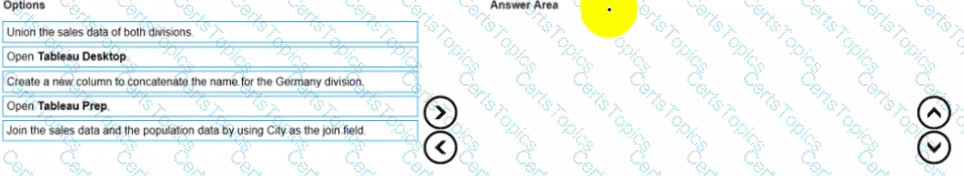
You company has two divisions located in the United States and Germany Bach division has a separate database. The following is a sample of the sales data for the division in the United States.
The following is a sample of the sales data for me division in Germany.
You have population data in a file named Populatio.csv. the following is a sample of the data.
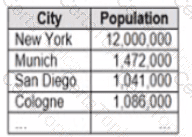
You plan to create a visualization that ml show tie sales per capita for each salesperson Each salesperson must be identified by identified by their full name.
You need to prepare the data to support the planned visualization. The data source must support being published .
Which four actions should you perform in order?
(Place the four correct options n order Use the arrows to move Options to Answer Area arrows to re-order the options.
Use Answer Area arrows to re-order the options)
You have the following line chart that shows the average sales by month.
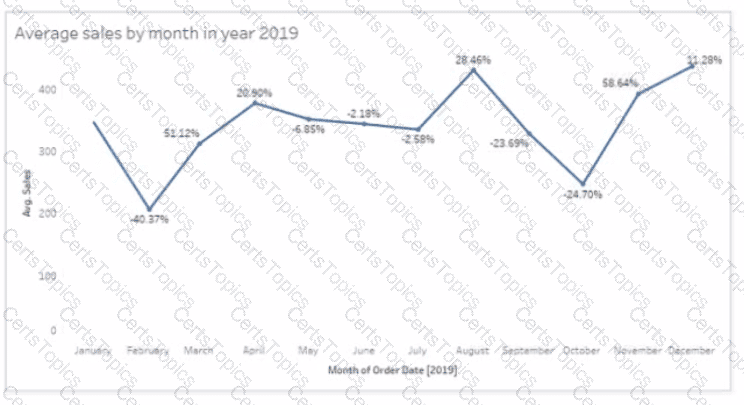
Which month had the biggest increase in swage sales compared to me previous month in 2019?
Copyright © 2021-2026 CertsTopics. All Rights Reserved