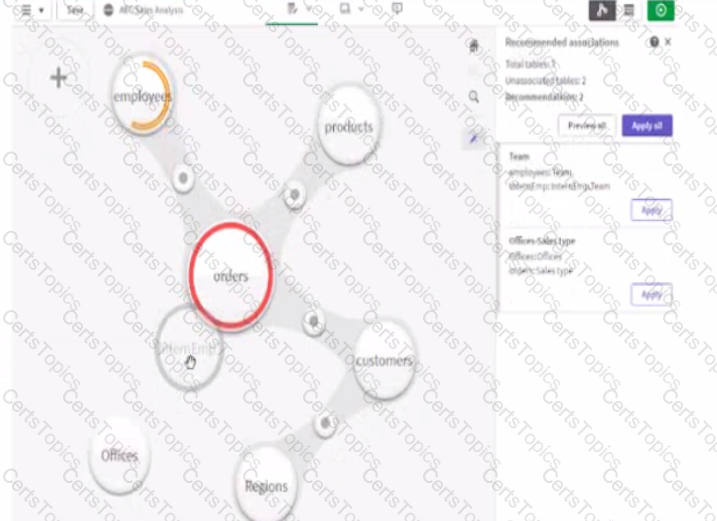
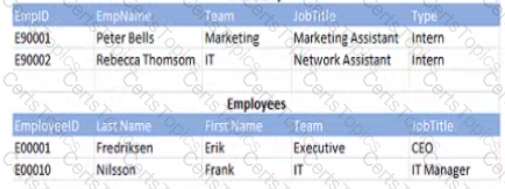
Refer to the exhibit.
A business analyst must add a list of interns to the current sates app. The app contains an existing employees table When the business analyst profiles the data the association vow displays possible associations as shown.
Which action should the business analyst take to meet the requirements?
A company that manages several tennis clubs uses an app mat includes three master measures TotalCost, Totallncome. and TotalMargin A business analyst needs to create a new table that utilizes master items and meets the following requirements:
• Number of bookings that users make
• Cost associated with booking (including electricity and indirect costs)
• Income obtained and profit originated m each booking
• Sales margin: percentage of margin over income
• Detail by tennis clubs
Which optimal expressions should the business analyst use?
A sales manager needs to visualize the company's sales. The sales manager needs to understand how sates and profitability are related over time. The visualization will be used in a printed annual report.
The business analyst has access to the following data:
• Order Dates
• Order ID
• Total Safes by Order
• Net profit margin%
• Cost of Goods Sow (COGS)
Which visualization should the business analyst use?
Copyright © 2021-2026 CertsTopics. All Rights Reserved
