Qlik Related Exams
QSBA2021 Exam


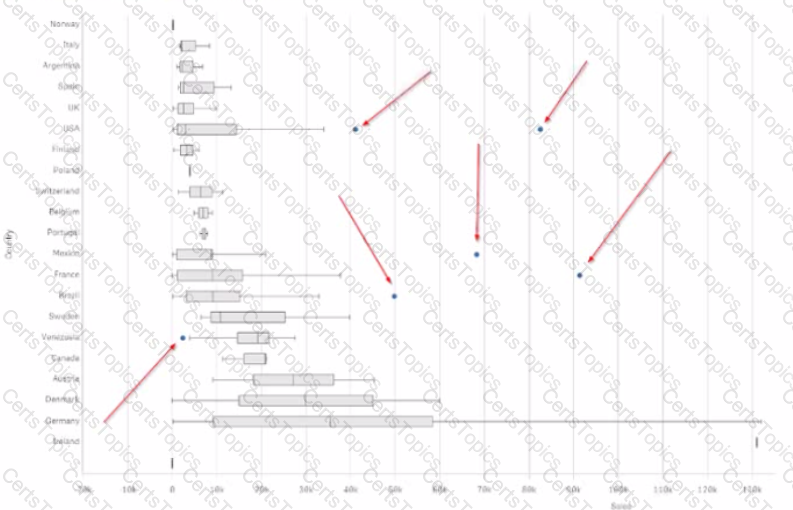
Refer to the exhibit
A business analyst is modifying a box plot End users report unexpected blue dots in a box plot
What should the business analyst do?

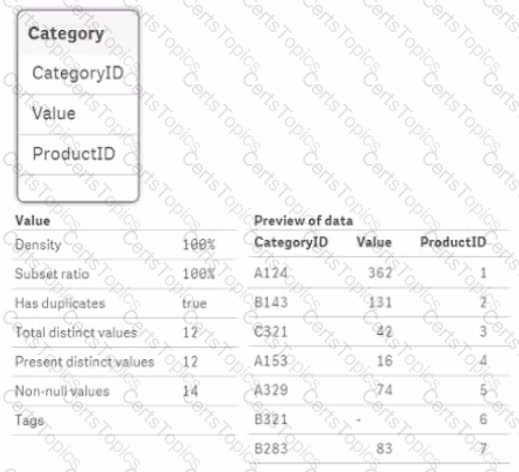
Refer to the exhibits
After the latest data reload a business analyst notices the value tor CategoryID 'B321' seems different What is causing this discrepancy?
A company that manages several tennis clubs uses an app mat includes three master measures TotalCost, Totallncome. and TotalMargin A business analyst needs to create a new table that utilizes master items and meets the following requirements:
• Number of bookings that users make
• Cost associated with booking (including electricity and indirect costs)
• Income obtained and profit originated m each booking
• Sales margin: percentage of margin over income
• Detail by tennis clubs
Which optimal expressions should the business analyst use?