The formula for reliability during constant failure rate conditions is: Use this formula to find the reliability of a product at 800 hours if MTBF = 600 hours.
Which of the following most influences consumer perception of quality?
What is the standard deviation of a process that operates to an exponential distribution with a mean of 25 units?
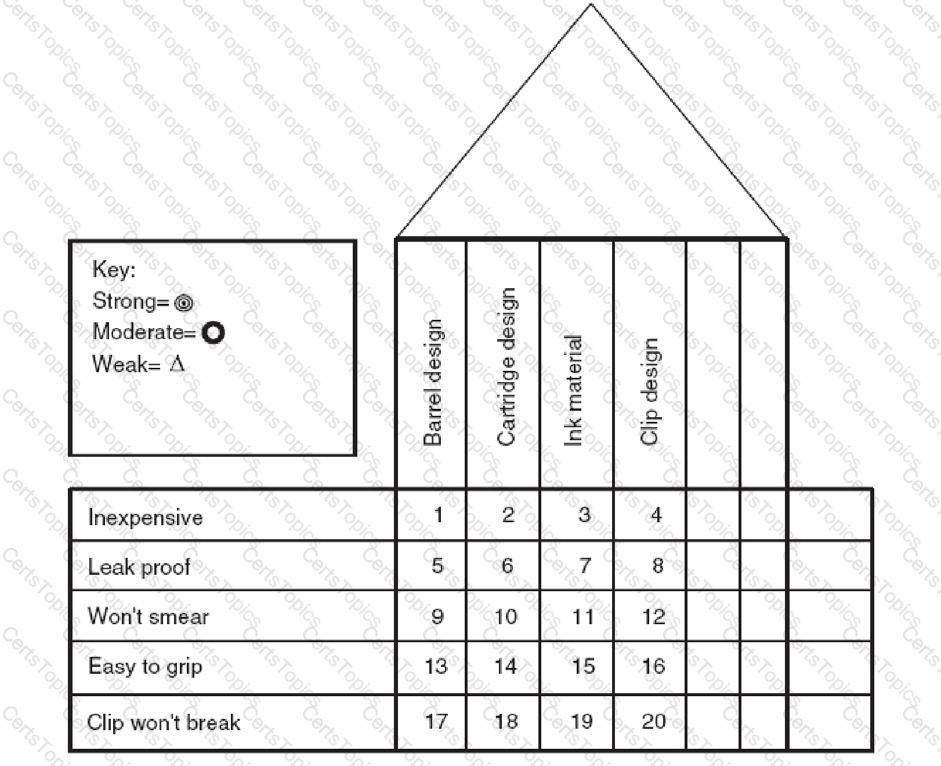
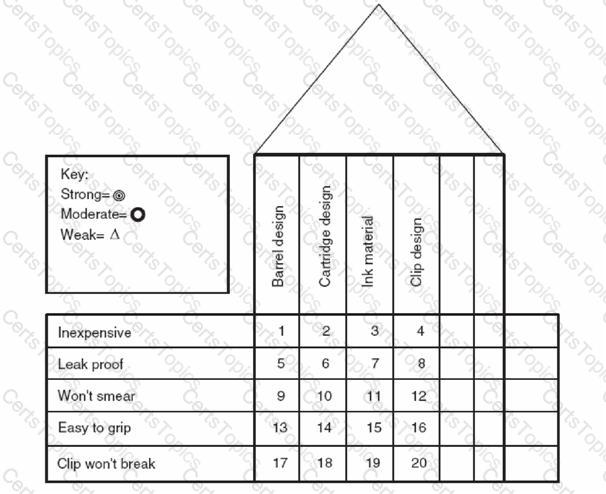
This QFD matrix was used in the design process for a ball point pen. What symbol is appropriate for the square labeled 6?

A Black Belt is going to monitor the number of defects on different size samples. Which of the following control charts would be most appropriate?
A control chart is to be used to display the number of non-conducting diodes. Each point on the chart represents the number of bad diodes in a box of 1000. The appropriate control chart to use is:
A process shows the following number of defectives. Each sample size for this process is
85.3 8 2 7 7 6 8 8 9 5.
Find the control limits.
What kind of Graph would help us to analyze stability of non-parametric distribution of data points?
The mean of a Poisson distribution is 2.94. Its variance is:
In measurement system analysis, which of the following pairs of data measures is used to determine total variance?
SMED is an acronym for activity that:
An observation above upper control limit is concluded as?
This QFD matrix was used in the design process for a ball point pen. What symbol is appropriate for the square labeled 1?

All of the following experimental designs could be used to investigate interactions EXCEPT
Ratio and Interval Scale of measurements are based on ______________type of data.
A process using a p-chart has pbar = 0.076 and nbar = 4.86. Find the control limits.
What is the value of the test statistic?
A process can be defined as a repetitive and systematic series of steps or activities where inputs are modified or assembled to achieve a _______________ result.
This QFD matrix was used in the design process for a ball point pen. What symbol is appropriate for the square labeled 9?
Which of the following tools should be used when a team is generating and prioritizing a list of options that include highly controversial issues?
When Tricia empties a box of capacitors she places it at a designated spot on her work table. Sam notices the empty box and brings a full box of capacitors from the stock room. This is an example of:
This QFD matrix was used in the design process for a ball point pen. What symbol is appropriate for the square labeled 12?

This QFD matrix was used in the design process for a ball point pen. What symbol is appropriate for the square labeled 8?
Which of the following statements is true about the theory of constraints?
An x-bar control chart has been established with control limits of 3.245 and 3.257, n = 5. An engineer collects the following sample and plots the average on the control chart: 3.257, 3,256, 3. 258, 3.259.
The distribution is:
Find Cp and Cpk.
The principle disadvantage of fractional factorial experiments is that:
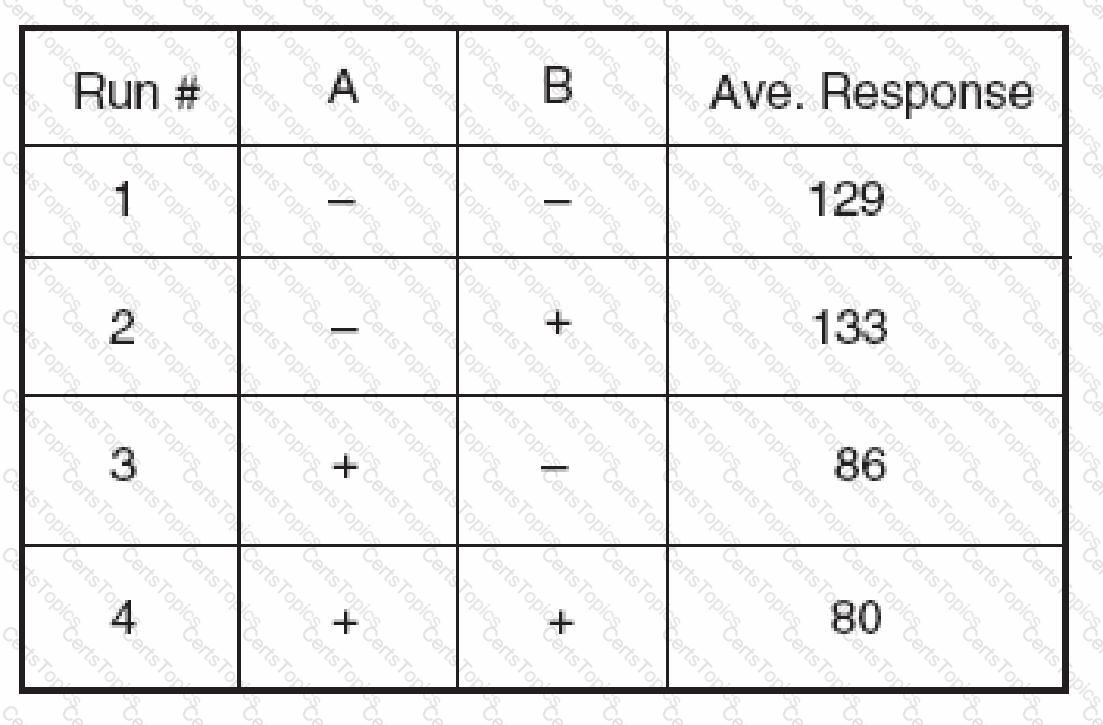
(Refer to the previous problem) The variance of the five replications for each run is calculated. Most of these variances are approximately equal but two are significantly lower than the others. The experimenters would be especially interested in those two runs if they want to optimize:
In a series of linked processes and associated feedback loops the product or service flows ________ and the information flows ________.
A team has been asked to reduce the cycle time for a process. The team decides to collect baseline data. It will do this by:
In a resolution III fractional factorial experimental design, main effects are confounded with:
A team wants a technique for obtaining a large number of possible reasons for excess variation in a dimension. They should use:
The primary metric for a project is reduced cost for process A. Baseline data might include:
A population is bimodal with a variance of 5.77. One hundred samples of size 30 are randomly collected and the 100 sample means are calculated. The standard deviation of these sample means is approximately:
The following data were collected on the diameters of turned shafts: 2.506 2.508 2.505 2.505. These values are:
I. Attribute data
II. Discrete data
III. Variables data
IV. Continuous data
A random sample of 2500 printed brochures is found to have a total of three ink splotches. The rate of ink splotches in PPM is:
A ____ from a sample is used to estimate a population _____. The two words that best fill these blanks are:
After a team has engaged in diversion activities they may need to employ a tool for conversion. Examples of such a tool are:
I. nominal group technique
II. Multivoting
III. cause and effect diagram
IV. activity network diagram
V. matrix diagrams
An engineer wants to try two hardening ovens to see whether they have different hardness scores. She cuts 8 pieces of bar stock in half, putting half of each in oven A and the other half in oven B. The following data are collected:
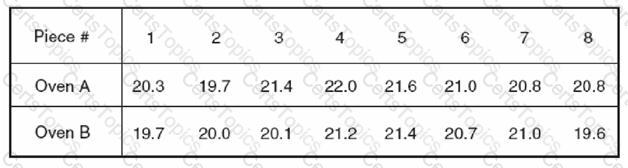
Do the data indicate that the ovens have different average scores? Assume differences are normally distributed.
Is it safe to assume that the interaction effects are negligible?
There are 14 different defects that can occur on a completed time card. The payroll department collects 328 cards and finds a total of 87 defects. DPU =
A medicine with efficacy of .52 is given to five patients. Find the approximate probability that at least one of the patients is cured. (Hint: Use the binomial formula.)
The Central Limit Theorem states that the distribution of sample means approximates a normal distribution if:
A team wants a technique for displaying the connection between various customer needs and various features on a product. They should use:
Customer segmentation refers to:
A random sample is selected from a population of measurements. The mean of the sample is not equal to the mean of the population. This is due to:
A stable, normally distributed process with specification 3.50 .03 has = 3.51 and = .016. What percent of the production violates specification?
A team studies a coil steel banding process and makes five changes resulting in productivity improvements of 2%, 2.8%, 2.4%, 2% and 3% respectively. These improvements are best described by which approach to problem solving?
The team in the above problem draws arrows from Post-It® notes that are causes to notes that are the effects of these causes. This step is best described by which approach to problem solving?
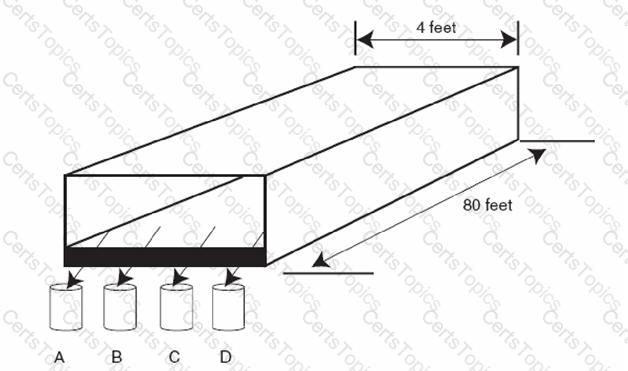
SCENARIO
A Six Sigma team is measuring the moisture content of corn starch as it leaves the conveyer belt of a dryer. They collect one sample four cups of starch at times indicated in the chart at fixed locations labeled A, B, C, and D across the end of the belt. See the diagram below.
Find the equation of the regression line for these sample data points: (1, 7) (3, 3) ( 3, 2) (5, –1)
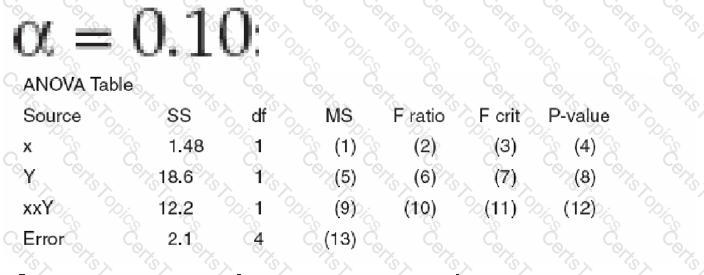
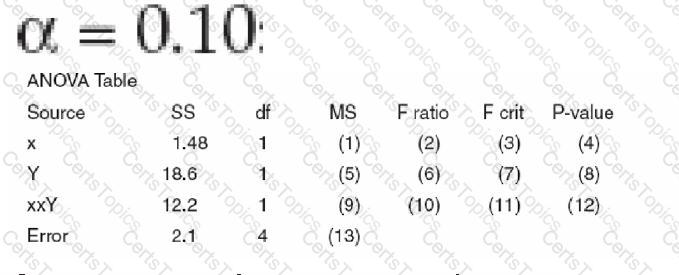
Find the value of (1) in the ANOVA table. Assume:
Copyright © 2021-2026 CertsTopics. All Rights Reserved