You want to add Custom shapes to your visualisation. Where can you add these new shapes?
Which aggregation is available without requiring a table calculation or calculated field?
True or False: Sets can be created on Measures
Which of the following are valid ways to Bold the Tooltip content in Tableau?
You have a visualization that uses multiple types of sorting.
How can you clear all sorting of the visualization?
________________ is hosted by Tableau to share our visualisations publically with the world.
What does the box in a box plot represent?
Which two types of aggregations can be applied to string fields? Choose two.
Which of the following is a discrete date part?
How can you MANUALLY assign geographic roles to a dimension from the data pane?
What does the following icon do in Tableau?
Larger image
What should you use to create headers in a visualization?
For Bullet Graphs we need at least ____________ measures
What statement correctly describes a requirement to create a reference line in Tableau?
How can you add color to marks in the view in Tableau?
What are three options to change the scope of a reference line? Choose three.
What are two use cases for creating hierarchies from the Data pane? Choose two.
To customize links based on the data in your dashboard, you can automatically enter field values as _______________ in URLs
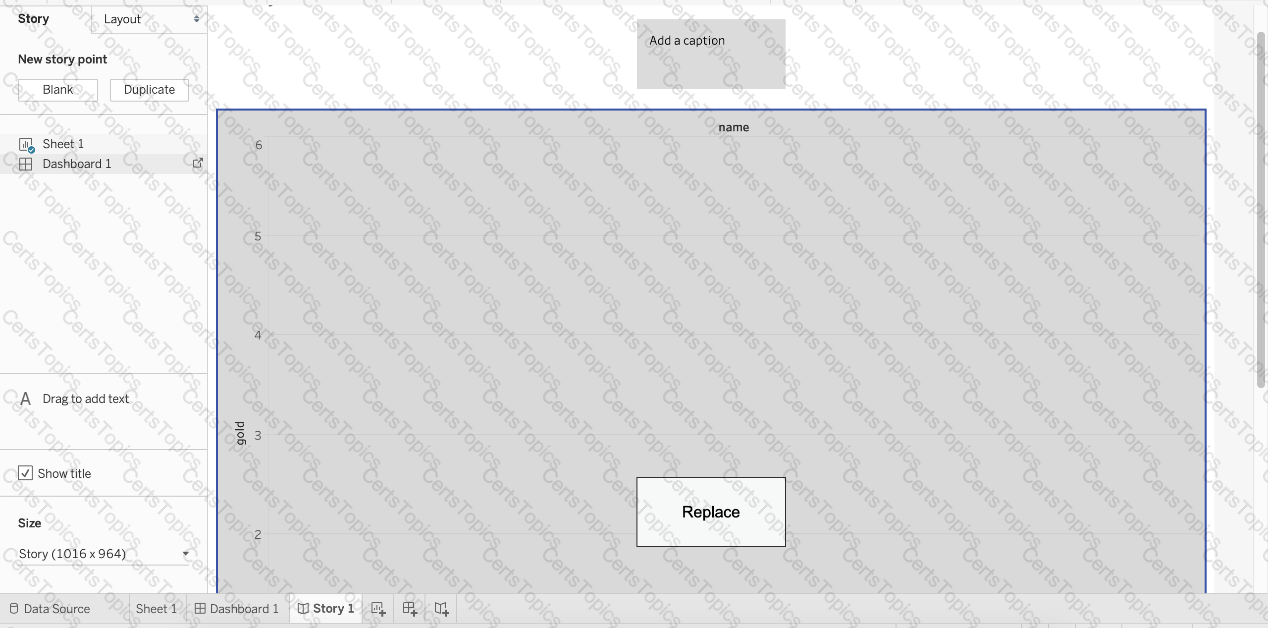
Is it possible to add both a Dashboard and a Worksheet at the same time to a Story Point in Tableau?
Which of the following are valid objects when creating a dashboard in Tableau? Choose 4.
When using a Blend, what is the color of tick-mark on the primary and secondary data sources respectively?
True or False: Context Filters are executed after Data Source filters
Which of the following 2 fields CANNOT be deleted in Tableau?
You view the relationship canvas shown in the following exhibit.
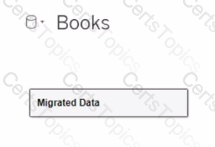
What does Migrated Data indicate?
If you decide you want to see all of the marks in the view at the most detailed level of granularity, you can __________________ the view.
You need to uniformly change the size for all marks in a view.
What should you do?
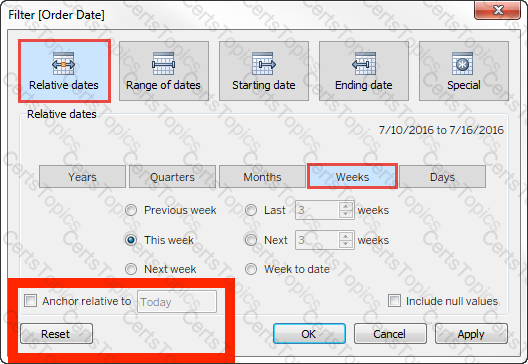
Which type of date filter can you use to choose a range of dates based on TODAY ()?
Which of the following is a valid way to create Sets in Tableau?
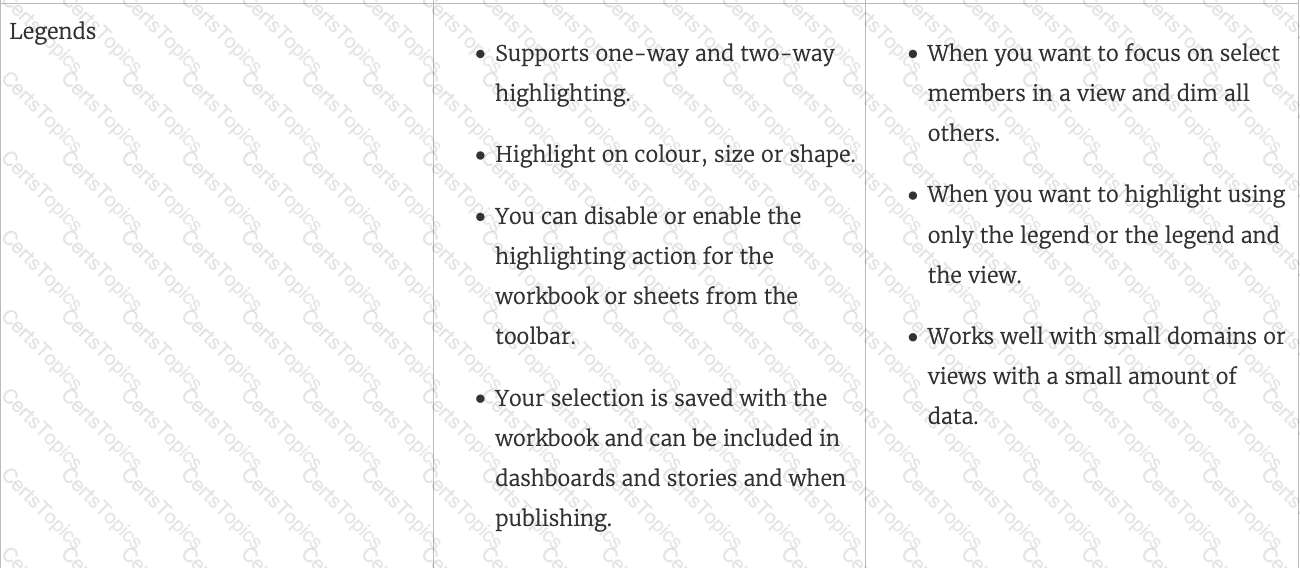
True or False: The Highlighting action can be disabled for the entire workbook.
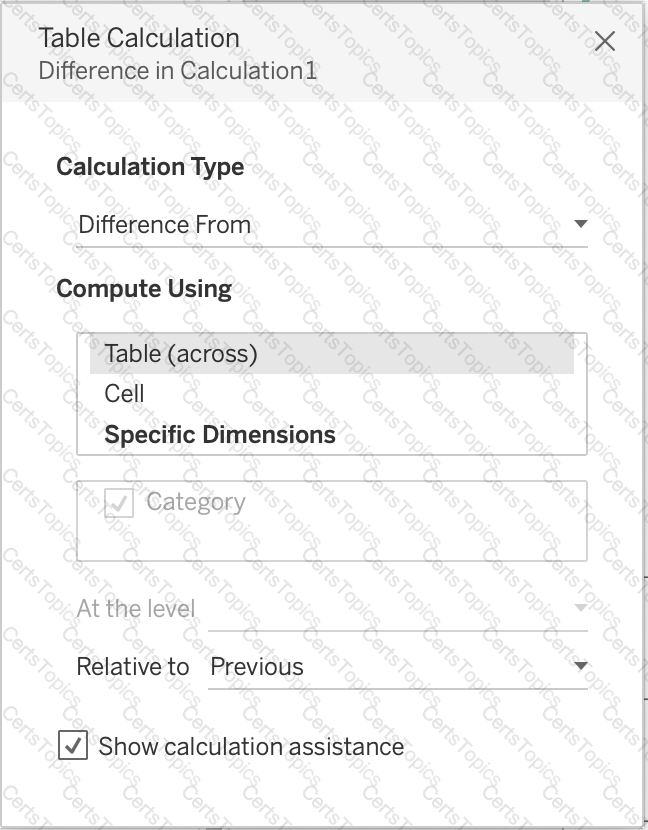
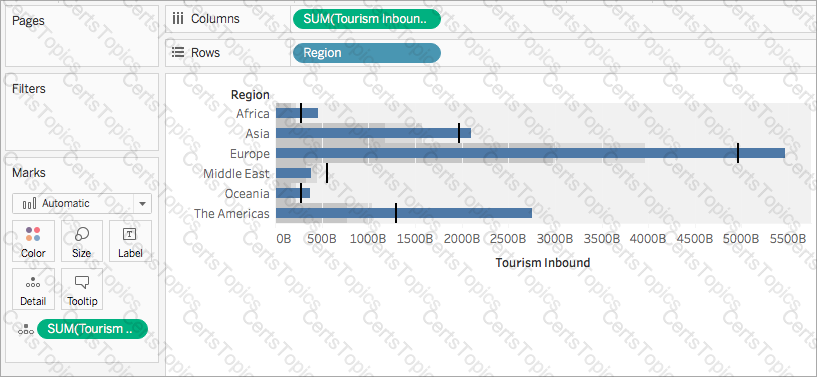
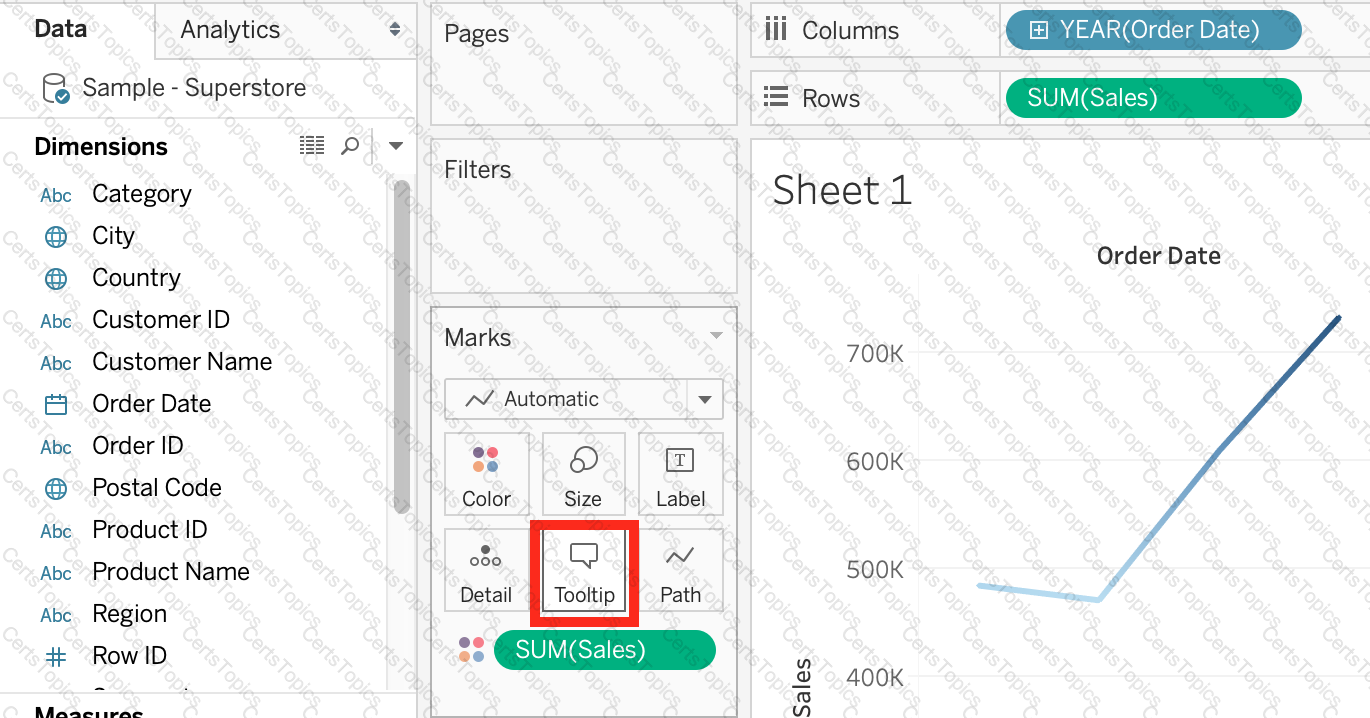
You have the following visualization.
You need to show how Internet Usage values change from year-to-year as a percentage. Which quick table calculation should you apply to the Internet Usage field?
When using a data source that has relationships, how can you add a join between two or more tables?
Which chart type uses automatically generated sizes that cannot be resized by using the Marks card?
What is created by a calculated field that has a formula of SUM(Sales)/SUM(Profit)?
Using the Time-series table, create a cross tab showing the Sales for each Item Number-ID, broken down by Assortments, then add Grand totals to the view. Which Item Number ID made the maximum sales across all assortments?
When field names in the Union do not match, then:
Which of the following can you use to create a Histogram?
You need to display the complete list of potential data connections when you connect to a server. What action should you perform?
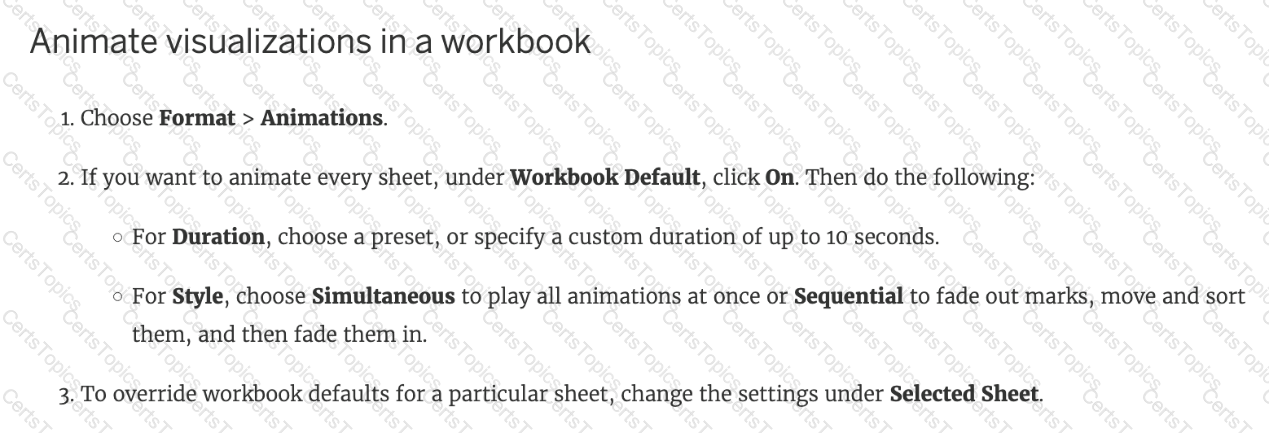
When using Animations in a Tableau, which of the following is the default duration for animations?
While borders and background colors let you visually highlight items on a dashboard, _________ lets you precisely space items.
The option to create bins is available for which type of field?
Which of the following fields would be best used as Dimensions?
When working with Excel, text file data, JSON file, .pdf file data, you can use _________________ to union files across folders, and worksheets across workbooks. Search is scoped to the selected connection.
Which of the following lets you group related dashboard items together so you can quickly position them?
Which of the following are benefits of combining sheets using dashboards?
Which of the following are benefits of using Data Extracts in Tableau?
Is SUM a table calculation?
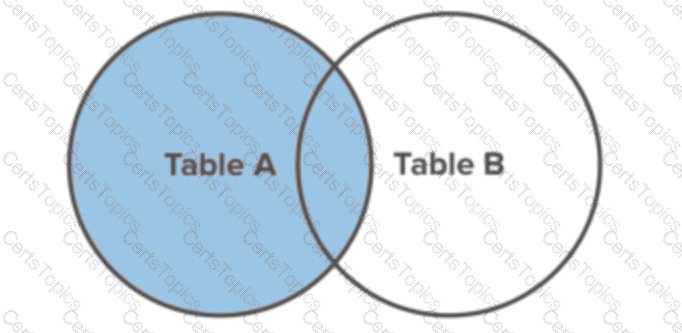
You may create a context filter to:
How can you change the default Tableau repository location?
Which of the following are True for Measure Names?
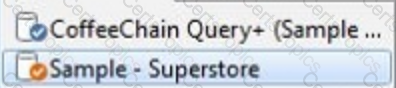
If you see the following Filter, then you're working with _______________________
Larger image
Creating a scatter plot requires a minimum of how many measures?
How can you create a packaged data source?
You have cleaned a data source properly, created some calculated fields and renamed some columns. You want to save these changes for future use cases. Which of the following would BEST satisfy this requirement?
How would you calculate GDP per capita in Tableau?
Which of the following is an example of a Date Part?
To display data that has both negative and positive quantitative values, Tableau Desktop will display marks by using__________________as the default.
In which situation should you save a workbook as a PDF document?
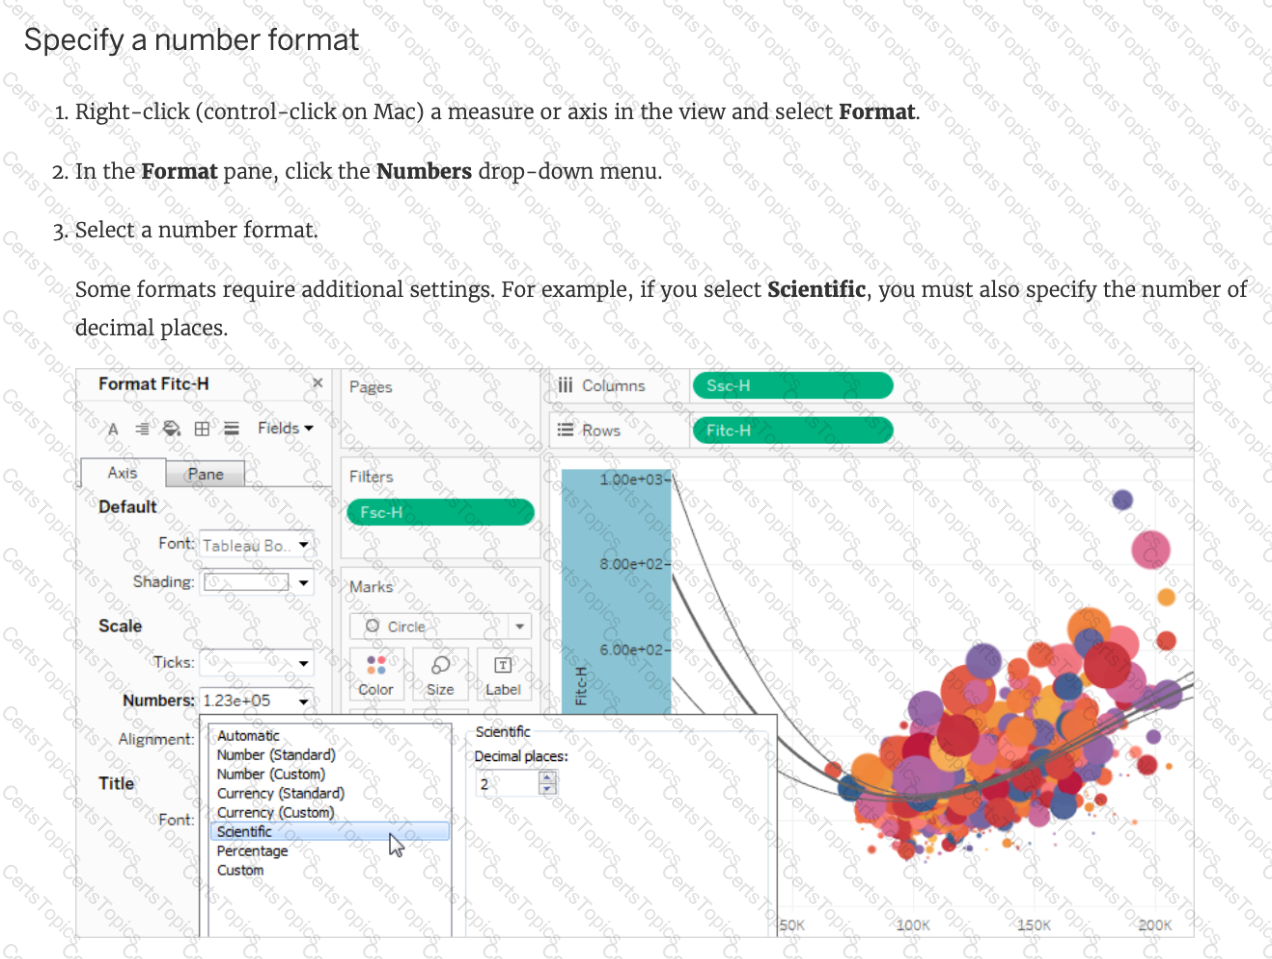
How can you format numbers in Tableau as currency?
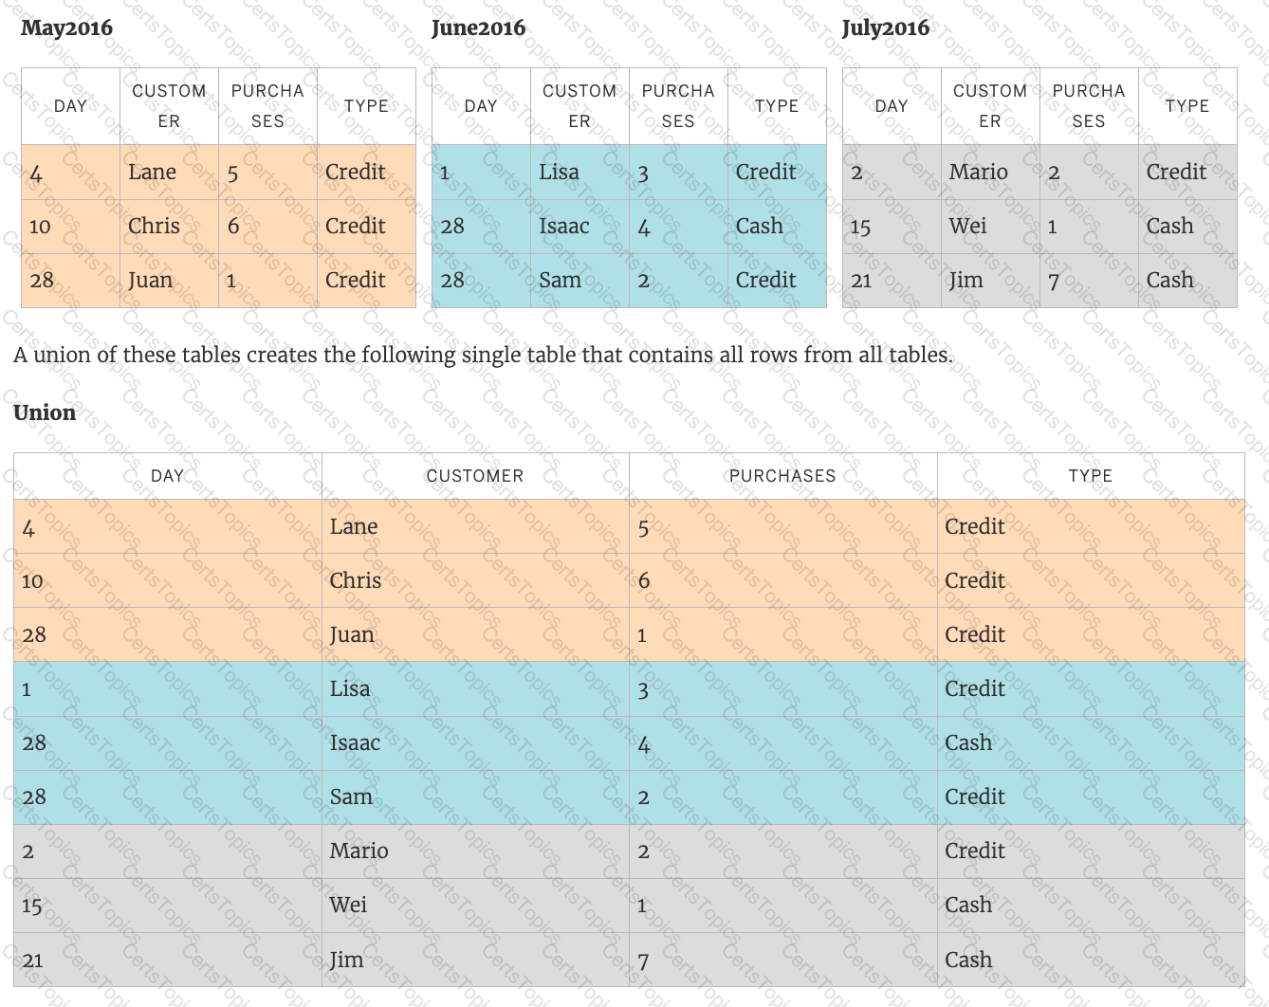
______________ is a method for appending values (rows) to tables. You can use this method if both tables have the same columns. The result is a virtual table that has the same columns but extends vertically by adding rows of data.
At a minimum, what do you need to create a simple scatter plot?
You have a scatter plot visualization.
What should you do to configure the visualization as a density map?
Broadly speaking, when users connect to Tableau, the data fields in their data set are automatically assigned a ____________ and a ____________.
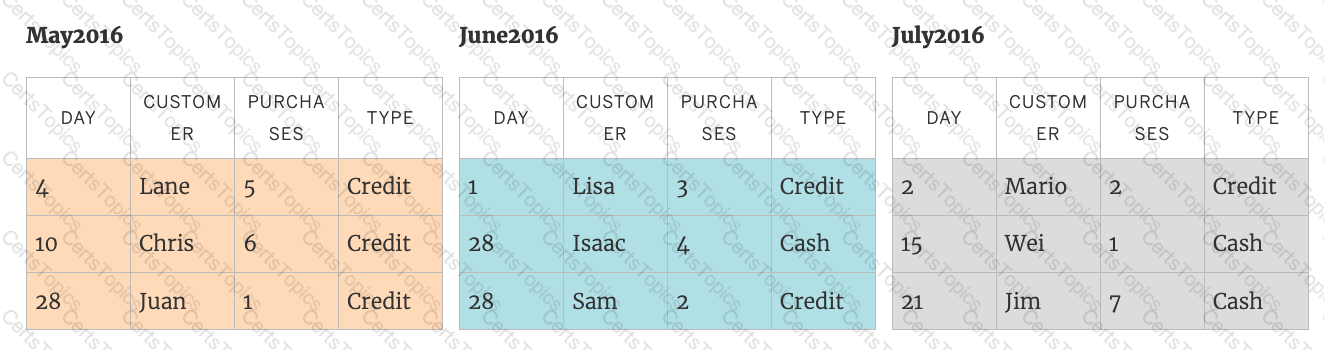
Which mark type is used in a highlight table?
When creating a histogram in Tableau, to what does bin size refer?
Which of the following are true about Dashboards in Tableau?
Which of the following are stored in a .tds file? Choose 3.
Which of the following are required to create a trend line?
True or False: A LEFT JOIN or INNER JOIN creates a row each time the join criteria is satisfied, which can result in duplicate rows. One way to avoid this is to use data blending instead.
Which of the following is the correct way to calculate Profit Ratio in Tableau?
Which of the following chart type makes use of 'binned' data?
For a relative date filter, the default anchor is _________________
Which of the following is a good reason for using a bullet graph?
In Tree maps, the size begins with the largest rectangle on the ________________ and the smallest rectangle on the ________________.
By default, measures placed in a view are aggregated by ______________
When should you use a relationship instead of a join for two data sets?
_______________ enables us to create workbooks and views, dashboards, and data sources in Tableau Desktop, and then publish this content to our own server.
What is a Tableau story point?
True or False: To concatenate fields, they must be of same data type
You have a workbook that contains one data source and you need to combine data from another database. What should you do first?
What is the following icon in the Data pane used to do?
Larger image
True or False: All rows from both tables are returned in an INNER JOIN
When you want to first apply a filter and THEN show the Top N or Bottom N elements, which of the following filters would you use?
Which of the following are correct ways to define a join in Tableau version 2020.3 and above?
True or False: Enabling any other type of sort (Field, alphabetic, or Nested) clears the manual sort we create.
By default, what does Tableau do when you connect to a data source?
What are two correct methods for creating a visual group? Choose two.
By default, measures placed in a view are aggregated. The type of aggregation applied ______________
Which of the following are valid ways to export a dashboard with multiple visualisations as an image?
Which of the following URL prefixes are permitted when creating a URL Action in Tableau?
What are two use cases for a story? Choose two.
Dimensions containing ____________ and ____________ values cannot be continuous.
You are creating a combined axis chart.
Where should you drag the second measure after dragging the first measure to the Rows shelf?
Which chart type uses automatically generated sizes that cannot be resized by using the Marks card?
Which two actions can you perform when you join tables from multiple connections? Choose two.
Are animations enabled by default in Tableau?
Copyright © 2021-2026 CertsTopics. All Rights Reserved

 Graphical user interface, application
Description automatically generated
Graphical user interface, application
Description automatically generated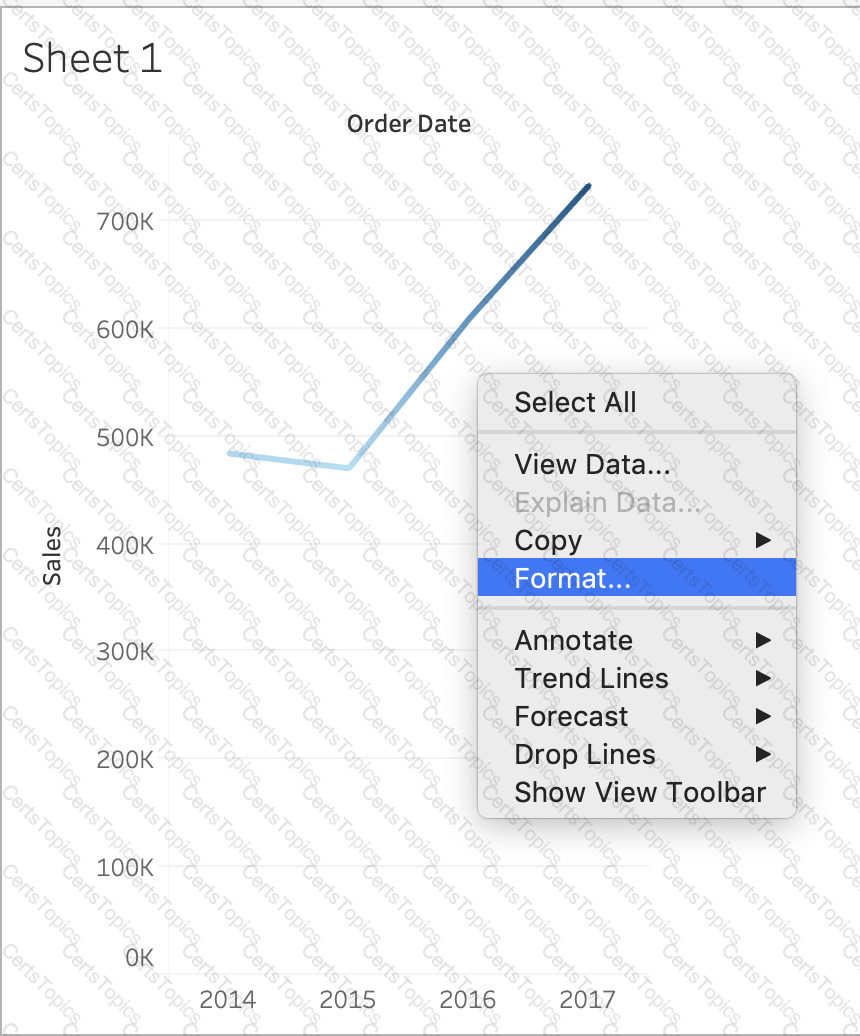 A picture containing line chart
Description automatically generated
A picture containing line chart
Description automatically generated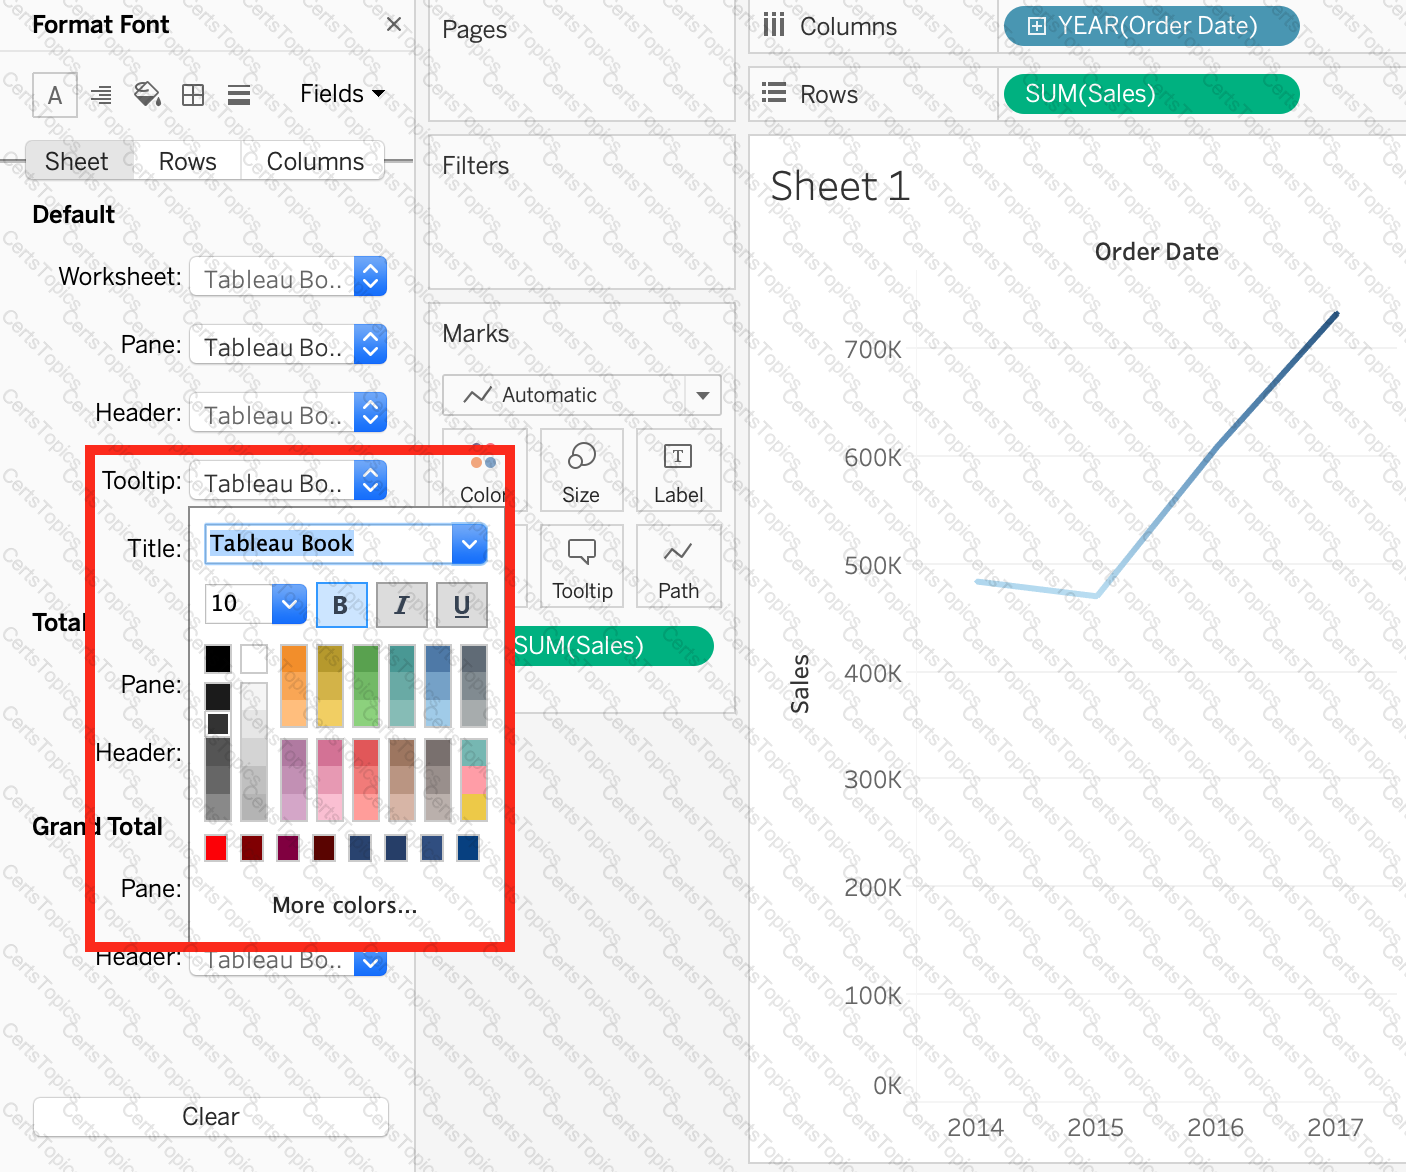 Graphical user interface
Description automatically generated
Graphical user interface
Description automatically generated
 Table
Description automatically generated
Table
Description automatically generated