A client has a large data set that contains more than 10 million rows.
A consultant wants to calculate a profitability threshold as efficiently as possible. The calculation must classify the profits by using the following specifications:
. Classify profit margins above 50% as Highly Profitable.
. Classify profit margins between 0% and 50% as Profitable.
. Classify profit margins below 0% as Unprofitable.
Which calculation meets these requirements?
A client notices that several groups are sharing content across divisions and are not complying with their data governance strategy. During a Tableau Server
audit, a consultant notices that the asset permissions for the client's top-level projects are set to "Locked," but that "Apply to Nested Projects" is not checked.
The consultant recommends checking "Apply to Nested Projects" to enforce compliance.
Which impact will the consultant's recommendation have on access to the existing nested projects?
A client has many published data sources in Tableau Server. The data sources use the same databases and tables. The client notices different departments
give different answers to the same business questions, and the departments cannot trust the data. The client wants to know what causes data sources to return
different data.
Which tool should the client use to identify this issue?
A new Tableau user created a simple dashboard on Tableau Server using supply chain data. Now, the user wants to know if they created the dashboard in
accordance with specific performance best practices.
Which approach should the consultant recommend for the client to make this determination?
A client is using Tableau to visualize data by leveraging security token-based credentials. Suddenly, sales representatives in the field are reporting that they
cannot access the necessary workbooks. The client cannot recreate the error from their offices, but they have seen screenshots from the field agents. The client
wants to restore functionality for the field agents with minimal disruption.
Which step should the consultant recommend to accomplish the client's goal?
A client wants to provide sales users with the ability to perform the following tasks:
· Access published visualizations and published data sources outside the company network.
· Edit existing visualizations.
· Create new visualizations based on published data sources.
. Minimize licensing costs.
Which site role should the client assign to the sales users?
From the desktop, open the CC workbook.
Open the City Pareto worksheet.
You need to complete the Pareto chart toshow the percentage of sales compared tothe percentage of cities. The chart mustshow references lines to visualize how thedata compares to the Pareto principle.
From the File menu in Tableau Desktop, clickSave.
From the desktop, open the CCworkbook. Use the US PopulationEstimates data source.
You need to shape the data in USPopulation Estimates by using TableauDesktop. The data must be formatted asshown in the following table.
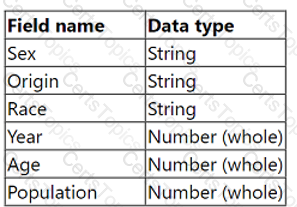
Open the Population worksheet. Enterthe total number of records contained inthe data set into the Total Recordsparameter.
From the File menu in Tableau Desktop,click Save.
From the desktop, open the NYC
Property Transactions workbook.
You need to record the performance of
the Property Transactions dashboard in
the NYC Property Transactions.twbx
workbook. Ensure that you start the
recording as soon as you open the
workbook. Open the Property
Transactions dashboard, reset the filters
on the dashboard to show all values, and
stop the recording. Save the recording in
C:\CC\Data\.
Create a new worksheet in the
performance recording. In the worksheet,
create a bar chart to show the elapsed
time of each command name by
worksheet, to show how each sheet in
the Property Transactions dashboard
contributes to the overall load time.
From the File menu in Tableau Desktop,
click Save. Save the performance
recording in C:\CC\Data\.
Use the following login credentials to sign in
to the virtual machine:
Username: Admin
Password:
The following information is for technical
support purposes only:
Lab Instance: 40201223
To access Tableau Help, you can open the
Help.pdf file on the desktop.
From the desktop, open the CC workbook.
Open the Categorical Sales worksheet.
You need to use table calculations to
compute the following:
. For each category and year, calculate
the average sales by segment.
. Create another calculation to
compute the year-over-year
percentage change of the average
sales by category calculation. Replace
the original measure with the year-
over-year percentage change in the
crosstab.
From the File menu in Tableau Desktop, click
Save.
From the desktop, open the CC workbook.
Open the Manufacturers worksheet.
The Manufacturers worksheet is used to
analyze the quantity of items contributed by
each manufacturer.
You need to modify the Percent
Contribution calculated field to use a Level
of Detail (LOD) expression that calculates
the percentage contribution of each
manufacturer to the total quantity.
Enter the percentage for Newell to the
nearest hundredth of a percent into the
Newell % Contribution parameter.
From the File menu in Tableau Desktop, click
Save.
From the desktop, open the CC workbook.
Open the Incremental worksheet.
You need to add a line to the chart that
shows the cumulative percentage of sales
contributed by each product to the
incremental sales.
From the File menu in Tableau Desktop, click
Save.
A company has a sales team that is segmented by territory. The team's manager wants to make sure each sales representative can see only data relevant to
that representative's territory in the team Sales Dashboard.
The team is large and has high turnover, and the manager wants the mechanism for restricting data access to be as automated as possible. However, the
team does not have a Tableau Data Management license.
What should the consultant recommend to meet the company's requirements?
A client wants to migrate their Tableau Server to Tableau Cloud. The Tableau Server is configured with three sites: Finance, Strategy, and Marketing. A
consultant must provide a solution that minimizes user impact and costs.
Which configuration should the consultant recommend for Tableau Cloud to meet the client's requirements?
A client has a published dashboard. They change the dashboard and then republish it. Now, usersreport that their web browser bookmarks to the dashboard
are broken.
What are two possible causes for this issue? Choose two.
A consultant migrated a data source to improve performance. The consultant wants to identify which workbooks need to be updated to point to the new data
source.
Which Tableau tool should the consultant use?
Copyright © 2021-2026 CertsTopics. All Rights Reserved
