From the desktop, open the CC workbook. Use the US Population Estimates data source.
You need to shape the data in US Population Estimates by using Tableau Desktop. The data must be formatted as shown in the following table.
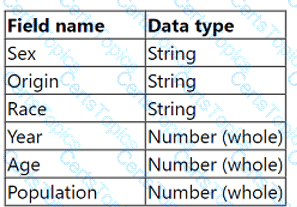
Open the Population worksheet. Enter the total number of records contained in the data set into the Total Records parameter.
From the File menu in Tableau Desktop, click Save.
From the desktop, open the CC workbook.
Open the Manufacturers worksheet.
The Manufacturers worksheet is used to
analyze the quantity of items contributed by
each manufacturer.
You need to modify the Percent
Contribution calculated field to use a Level
of Detail (LOD) expression that calculates
the percentage contribution of each
manufacturer to the total quantity.
Enter the percentage for Newell to the
nearest hundredth of a percent into the
Newell % Contribution parameter.
From the File menu in Tableau Desktop, click
Save.
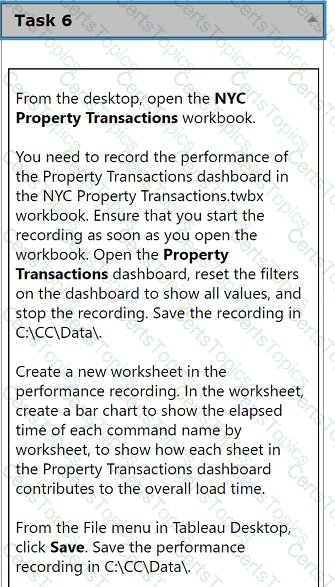
From the desktop, open the NYC
Property Transactions workbook.
You need to record the performance of
the Property Transactions dashboard in
the NYC Property Transactions.twbx
workbook. Ensure that you start the
recording as soon as you open the
workbook. Open the Property
Transactions dashboard, reset the filters
on the dashboard to show all values, and
stop the recording. Save the recording in
C:\CC\Data\.
Create a new worksheet in the
performance recording. In the worksheet,
create a bar chart to show the elapsed
time of each command name by
worksheet, to show how each sheet in
the Property Transactions dashboard
contributes to the overall load time.
From the File menu in Tableau Desktop,
click Save. Save the performance
recording in C:\CC\Data\.
From the desktop, open the CC workbook.
Open the City Pareto worksheet.
You need to complete the Pareto chart to show the percentage of sales compared to the percentage of cities. The chart must show references lines to visualize how the data compares to the Pareto principle.
From the File menu in Tableau Desktop, click Save.
Use the following login credentials to sign in
to the virtual machine:
Username: Admin
Password:
The following information is for technical
support purposes only:
Lab Instance: 40201223
To access Tableau Help, you can open the
Help.pdf file on the desktop.
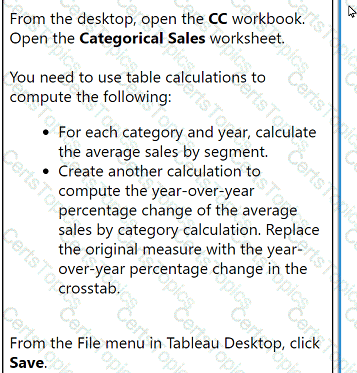
From the desktop, open the CC workbook.
Open the Categorical Sales worksheet.
You need to use table calculations to
compute the following:
. For each category and year, calculate
the average sales by segment.
. Create another calculation to
compute the year-over-year
percentage change of the average
sales by category calculation. Replace
the original measure with the year-
over-year percentage change in the
crosstab.
From the File menu in Tableau Desktop, click
Save.
From the desktop, open the CC workbook.
Open the Incremental worksheet.
You need to add a line to the chart that
shows the cumulative percentage of sales
contributed by each product to the
incremental sales.
From the File menu in Tableau Desktop, click
Save.
A business analyst needs to create a view in Tableau Desktop that reports data from both Excel and MSSQL Server.
Which two features should the business analyst use to create the view? Choose two.
A client's fiscal calendar runs from February 1 through January 31.
How should the consultant configure Tableau to use the client's fiscal calendar when building date charts?
A consultant is designing a dashboard that will be consumed on desktops, tablets, and phones. The consultant needs to implement a dashboard design that
provides the best user experience across all the platforms.
Which approach should the consultant take to achieve these results?
A client wants to see data for only the most recent day in the dataset that is updated intermittently. The solution should offer the best caching performance.
Which approach should the consultant use to produce the desired results?
A client builds a dashboard that presents current and long-term stock measures. Currently, the data is at a daily level. The data presents as a bar chart that
presents monthly results over current and previous years. Some measures must present as monthly averages.
What should the consultant recommend to limit the data source for optimal performance?
A consultant wants to improve the performance of reports by moving calculations to the data layer and materializing them in the extract.
Which calculation should the consultant use?
A client uses Tableau Data Management and notices that when they view a data source, they sometimes see a different count of workbooks in the Connected
Workbooks tab compared to the lineage count in Tableau Catalog.
What is the cause of this discrepancy?
A client wants to report Saturday and Sunday regardless of the workbook's data source's locale settings.
Which calculation should the consultant recommend?
A client is considering migrating from Tableau Server to Tableau Cloud.
Which two elements are determining factors of whether the client should use Tableau Server or Tableau Cloud? Choose two.
A client wants to provide sales users with the ability to perform the following tasks:
· Access published visualizations and published data sources outside the company network.
· Edit existing visualizations.
· Create new visualizations based on published data sources.
. Minimize licensing costs.
Which site role should the client assign to the sales users?
A client notices that several groups are sharing content across divisions and are not complying with their data governance strategy. During a Tableau Server
audit, a consultant notices that the asset permissions for the client's top-level projects are set to "Locked," but that "Apply to Nested Projects" is not checked.
The consultant recommends checking "Apply to Nested Projects" to enforce compliance.
Which impact will the consultant's recommendation have on access to the existing nested projects?
A client has a published data source in Tableau Server and they want to revert to the previous version of the data source. The solution must minimize the impact
on users.
What should the consultant do to accomplish this task?
An online sales company has a table data source that contains Order Date. Products ship on the first day of each month for all orders from the previous month.
The consultant needs to know the average number of days that a customer must wait before a product is shipped.
Which calculation should the consultant use?
An executive-level workbook leverages 37 of the 103 fields included in a data source. Performance for the workbook is noticeably slower than other workbooks
on the same Tableau Server.
What should the consultant do to improve performance of this workbook while following best practice?
Copyright © 2021-2026 CertsTopics. All Rights Reserved
