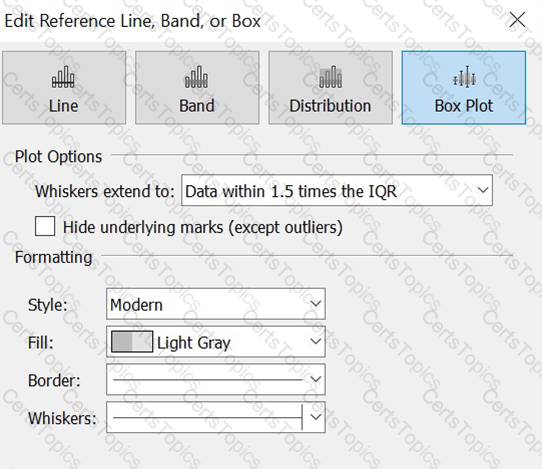
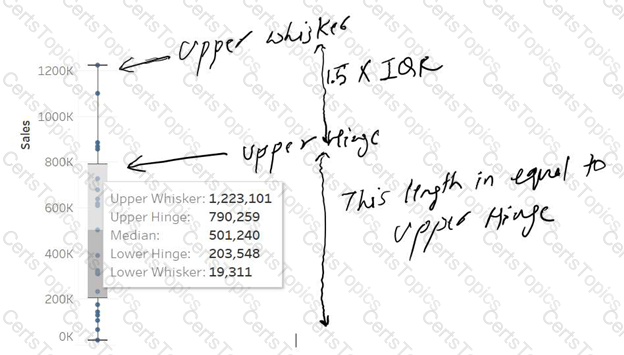
In a box plot, how we can calculate the length of the Upper whisker?
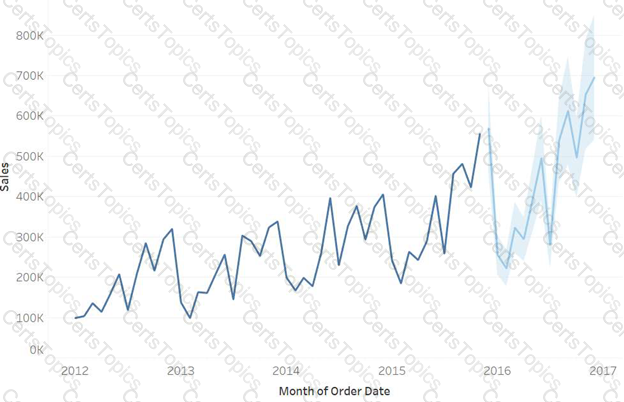
In Forecast, what is the shaded region?
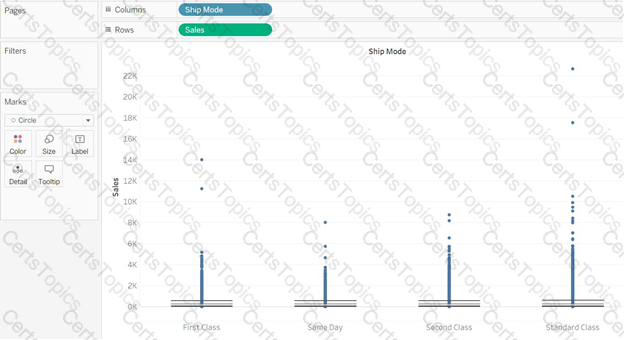
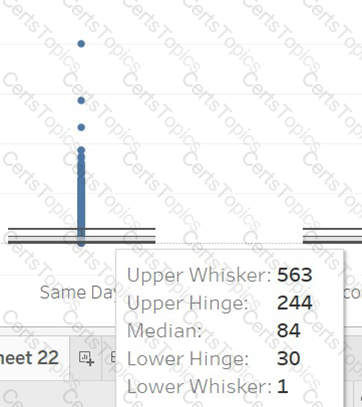
Connect to the "Global Superstore" data source and use the Orders table. Create a box-plots to show the sales distribution for each ship mode. Which of the following ship modes have the same median?
In your view, you are using a background image. How can you find the X and Y coordinates on your image?
Copyright © 2021-2026 CertsTopics. All Rights Reserved