Labour Day Special - Limited Time 65% Discount Offer - Ends in 0d 00h 00m 00s - Coupon code: top65certs

Sure Pass Exam ENOV612-PRG PDF

Page: 3 / 5
Total 138 questions

V6 ENOVIA V6 Program Central (V6R2012) Questions and Answers

Question 9

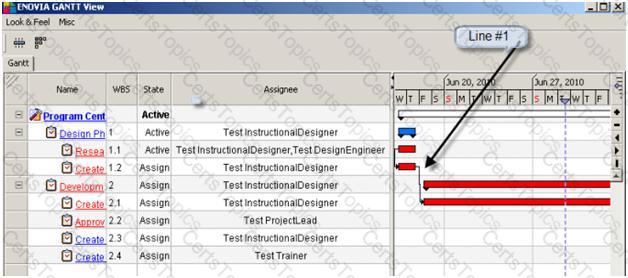
In the image below what is “Line #1” indicating?

Options:

A.

Risk

B.

Dependency

C.

Current Time

D.

Issue

Question 10

If you select the Metrics Icon on the below dashboard, what happens?

Options:

A.

Data that has been generated will be displayed in a series of graphs

B.

A Financial line graph will be displayed that will show actual costs of the program

C.

A Bar chart will be displayed with the Actual and Estimated costs

D.

A Pie chart will be displayed indicating the Cost Ratio breakdown

Question 11

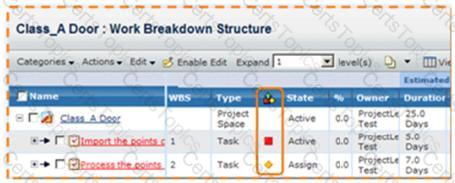
What does the red square in the following image, indicate?

Options:

A.

The task is not complete and the current date is after the task estimated finish date

B.

The task is not complete and there are less than 5 days before the project's estimated finish date

C.

The task is complete

D.

The task has not started

Question 12

To add a subtask under a parent task, on the WBS screen you would select the parent task and then click

Options:

A.

Add to Selected

B.

Add Under Selected

C.

Add Subtask Below

D.

Insert Under Selected

Page: 3 / 5
Total 138 questions